Gold Price Forecast: XAU/USD sees establishment below $1,750 as focus shifts to Jackson Hole
- Gold prices are likely to sustain below $1,750.00 as investors await US Jackson Hole Symposium.
- Mixed commentary from Fed policymakers on policy guidance has confused investors.
- Apart from the US Jackson Hole Symposium, the US Durable Goods data also hold significant importance.
Gold price (XAU/USD) has declined consecutively for five trading sessions after printing a monthly high of $1,807.96. The precious metal has slipped below $1,750.00 for the first time in August. It is likely to establish below the above-mentioned critical point as investors are trimming their longs from gold assets dramatically on an expectation of hawkish guidance by the Federal Reserve (Fed).
Earlier, observing mixed comments from the Fed minutes on policy guidance brought exhaustion to the gold rally. St. Louis Fed President James Bullard favored one more 75 basis points (bps) interest rate hike to bring price stability sooner. While a few Fed policymakers have passed a commentary of slow down the pace of hiking interest rates to safeguard their economy from inflation risks ahead.
Geopolitical tensions are also weighing heavily on gold prices as that Chinese President Xi Jinping and Russian President Vladimir Putin have confirmed that they will attend the G20 summit in November. This may refresh the mankind assault by Moscow in Ukraine.
On the economic data front, investors are awaiting the release of the US Durable Goods Orders data, which is expected to decline to 0.6% from the prior release of 2%. In times, when the US economy has already displayed an unchanged US core Consumer Price Index (CPI), a decline in the economic data is not lucrative for the US dollar index (DXY).
Gold technical analysis
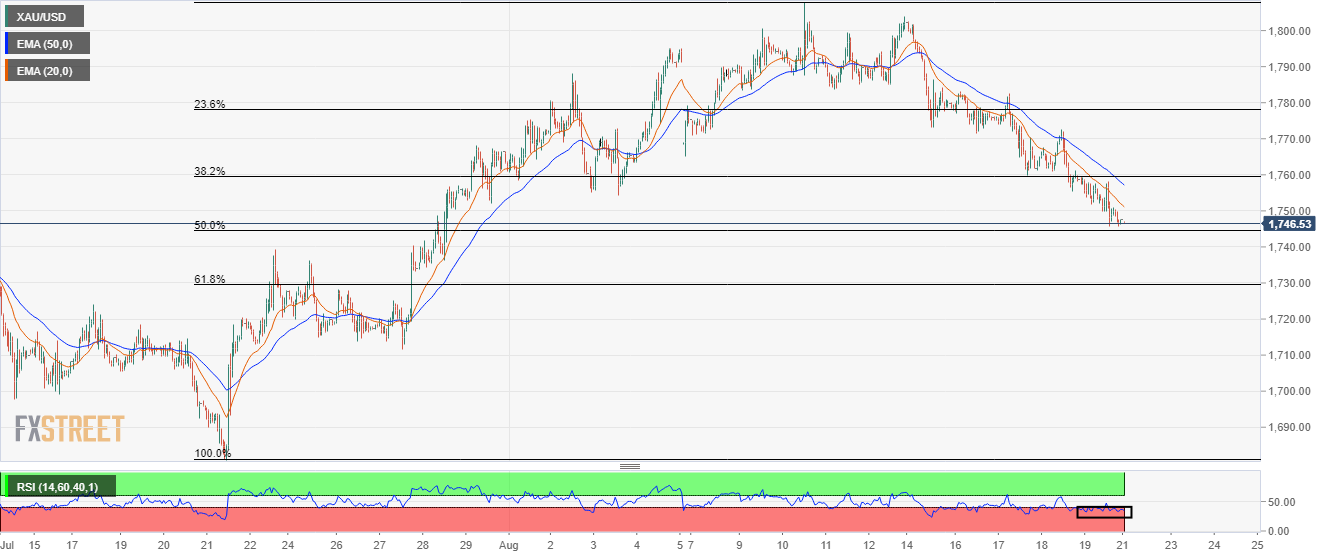
On an hourly scale, gold prices have declined to near 50% Fibonacci retracement (placed from July 21 low at $1,680.91 to August 10 high at $1,807.93) at $1,744.70. The 20-and 50-period Exponential Moving Averages (EMAs) at $1,751.90 and $1,757.50 respectively are declining sharply, which adds to the downside filters. Meanwhile, the Relative Strength Index (RSI) (14) is oscillating in a bearish range of 20.00-40.00, which favors more downside ahead.
Gold hourly chart