WTI Price Analysis: Bulls aim for $73.80 critical resistance
- WTI extends two-day uptrend to refresh the highest level in a fortnight.
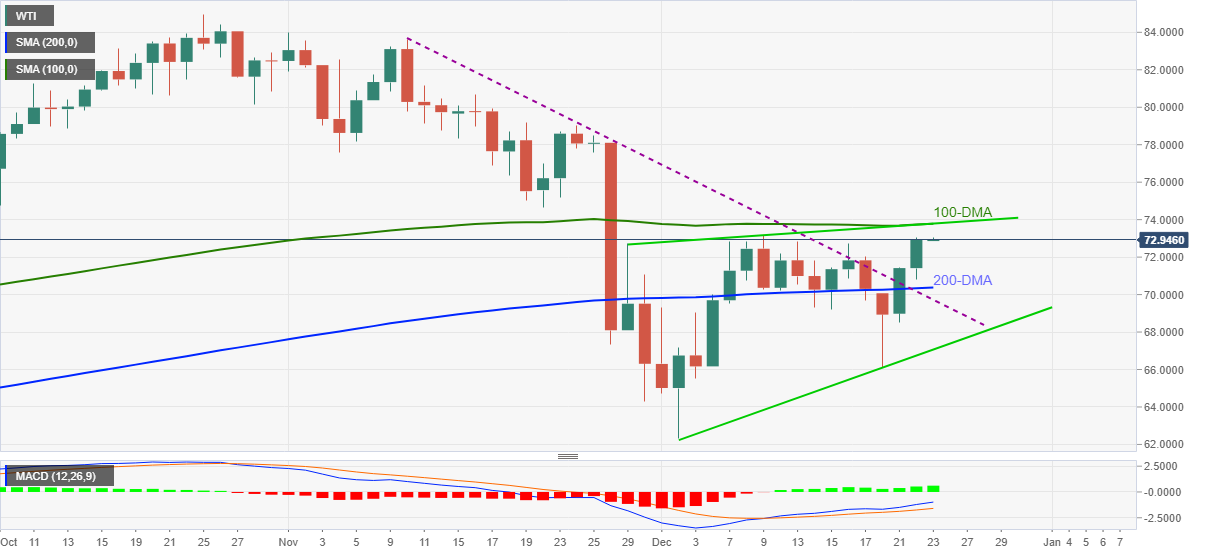
- Bullish MACD signals back sustained break of 200-DMA, previous resistance line from November.
- 100-DMA, rising wedge’s resistance line challenge immediate upside.
WTI crude oil pierces $73.00 threshold to poke monthly high, flashed before two weeks, during Thursday’s Asian session. In doing so, the black gold justifies a clear upside break of the 200-DMA and a descending trend line from November 10.
Given the bullish MACD signals favoring the latest breakout, the present upside momentum is likely to extend.
However, a convergence of the 100-DMA and upper line of a short-term rising wedge bearish chart pattern, near $73.80, becomes crucial for the WTI bulls.
Adding to the upside filter is the November 22 swing low of $74.65, a break of which will direct the oil prices towards the early November’s bottom surrounding $77.60 and then to the $80.00 threshold.
On the contrary, pullback moves may initially aim for the 200-DMA level of $70.37 before retesting the resistance-turned-support line close to $69.70.
Should WTI sellers conquer $69.70 support, the lower line of the stated rising wedge, near $67.00 will be crucial as a break of which will direct the prices towards the monthly low near $62.30.
WTI: Daily chart
Trend: Further upside expected