NZD/USD Price Analysis: Bulls testing descending triangle to aim for 0.7200
- NZD/USD refreshes intraday low, teasing confirmation of a bullish chart pattern.
- Weekly support line, 200-HMA joins firmer RSI to challenge bears.
- Monthly top, early June’s swing high lure pair buyers.
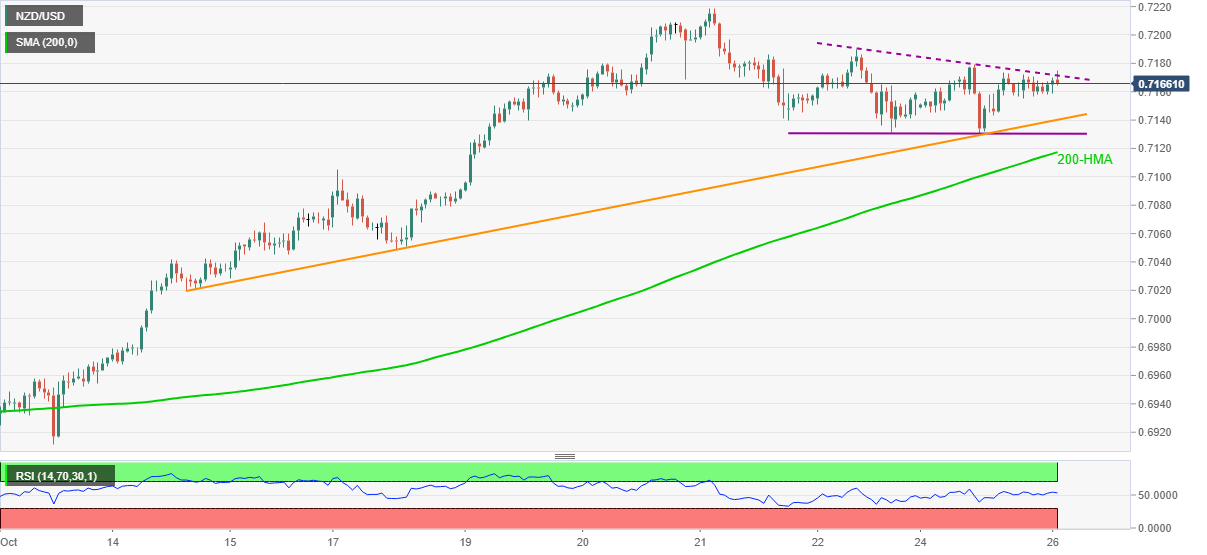
NZD/USD pokes resistance line of a two-day-old descending triangle around 0.7170, up 0.15% intraday, during early Tuesday.
Given the Kiwi pair’s ability to rebound from an ascending trend line from October 14, not to forget staying beyond 200-HMA, amid a firmer RSI line, the kiwi buyers are likely to keep the reins.
Even so, a clear upside break of 0.7170 becomes necessary for the NZD/USD buyers to aim for the 0.7200 threshold.
Following that, the monthly high near 0.7220, also a four-month peak, will challenge the quote’s further upside ahead of the June 07 high surrounding 0.7245.
Meanwhile, the stated weekly support line and the triangle’s lower line, respectively around 0.7140 and 0.7130, restrict short-term NZD/USD downside.
Also acting as downside filters are the 200-HMA level of 0.7117 and the 0.7100 psychological magnet, a break of which will direct the pair sellers toward the mid-month low close to 0.7020.
NZD/USD: Hourly chart
Trend: Further upside expected