US Dollar Index looks firmer, extends the recovery to 92.70
- DXY adds to recent gains and climbs to the 92.70 region.
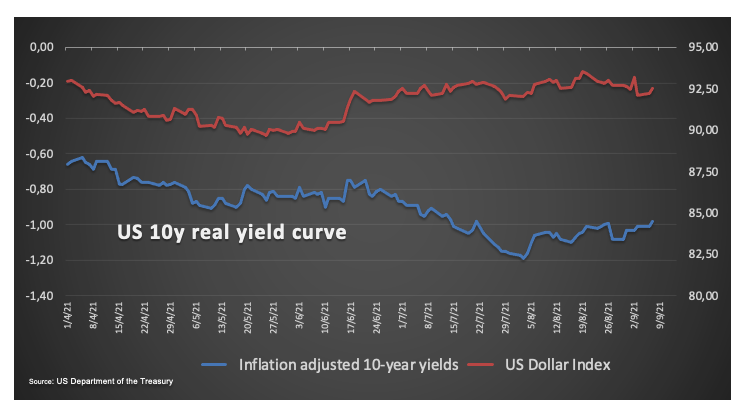
- US 10-year note yields correct from recent tops above 1.38%.
- MBA Mortgage Applications, IBD/TIPP Index next on tap.
The recovery of the greenback remains well and sound for yet another session and pushes the US Dollar Index (DXY) to fresh tops in the 92.70 zone midweek.
US Dollar Index looks to data, yields
The index advances for the third session in a row and picks up extra pace on the back of the persistent softness in the risk complex and the recent moderate rebound in US yields.
In fact, yields of the key US 10-year note climbed to new multi-day highs beyond 1.38% on Tuesday, putting further distance from monthly lows in the sub-1.27% area (September 3).
The unabated progress of the delta variant of the coronavirus in combination with the investors’ perception that the US economic recovery might have slowed its pace have been lending extra legs to the buck and sustaining the rebound in DXY.
Later in the US data space comes the weekly report on Mortgage Applications by the MBA, JOLTs Job Openings, the IBD/TIPP Index, Consumer Credit Change and the API’s account of US crude oil supplies.
What to look for around USD
The index moves further north and already reclaimed the 92.70 zone on the back of perseverant COVID jitters and doubts surrounding the rebound in the economic activity, all in a scenario of rising yields. Further support for the dollar is also expected to come in the form of high inflation, tapering prospects and the performance of the US economic recovery vs. its peers overseas.
Key events in the US this week: Initial Claims (Thursday) – Producer Prices (Friday).
Eminent issues on the back boiler: Biden’s multi-billion plan to support infrastructure and families. US-China trade conflict under the Biden’s administration. Tapering speculation vs. economic recovery. US real interest rates vs. Europe. Debt ceiling debate. Geopolitical risks stemming from Afghanistan.
US Dollar Index relevant levels
Now, the index is advancing 0.17% at 92.68 and a break above 92.77 (20-day SMA) would open the door to 93.18 (high Aug.27) and then 93.72 (2021 high Aug.20). On the flip side, the next down barrier emerges at 91.94 (monthly low Sep.3) followed by 91.78 (monthly low Jul.30) and finally 91.66 (100-day SMA).