WTI Price Analysis: Heavy around $68.50 as 50-SMA challenges short-term support break
- WTI extends Friday’s pullback moves, refreshes intraday low.
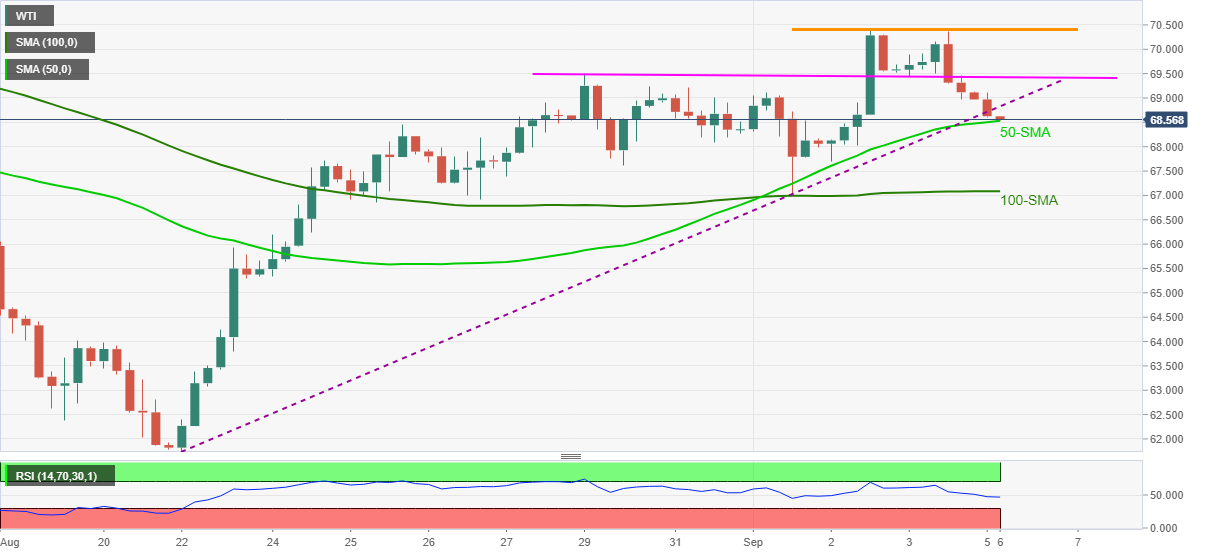
- Downside break of a two-week-old rising trend line, descending RSI favor sellers.
- 100-SMA adds to the downside filters, bulls will wait for fresh monthly high.
WTI remains pressured around $68.50, down 0.60% intraday amid Monday’s Asian session. In doing so, the black gold justifies the recent downside break of a two-week-old rising support line, now resistance, amid descending RSI line.
Also favoring the WTI sellers could be the confirmation of double tops bearish formation, via a clear downside trading below the late August tops.
However, 50-SMA near $68.50 challenges the oil sellers targeting the monthly low around $67.00, also comprising 100-SMA.
In a case where WTI bears keep reins past $67.00, odds of witnessing $64.00, comprising August 19–20 levels, can’t be ruled out.
On the flip side, corrective pullback needs to regain above the previous support line of $68.85, as well as cross August month’s high of $69.50, to restore short-term bullish bias.
Even so, the oil bulls remain skeptical unless witnessing a clear upside break of the monthly peak, also the double tops, around $70.40-45.
WTI: Four-hour chart
Trend: Further weakness expected