GBP/USD Price Analysis: En route 11-week-old support around 1.3800
- GBP/USD stands on slippery ground, drops for third consecutive day.
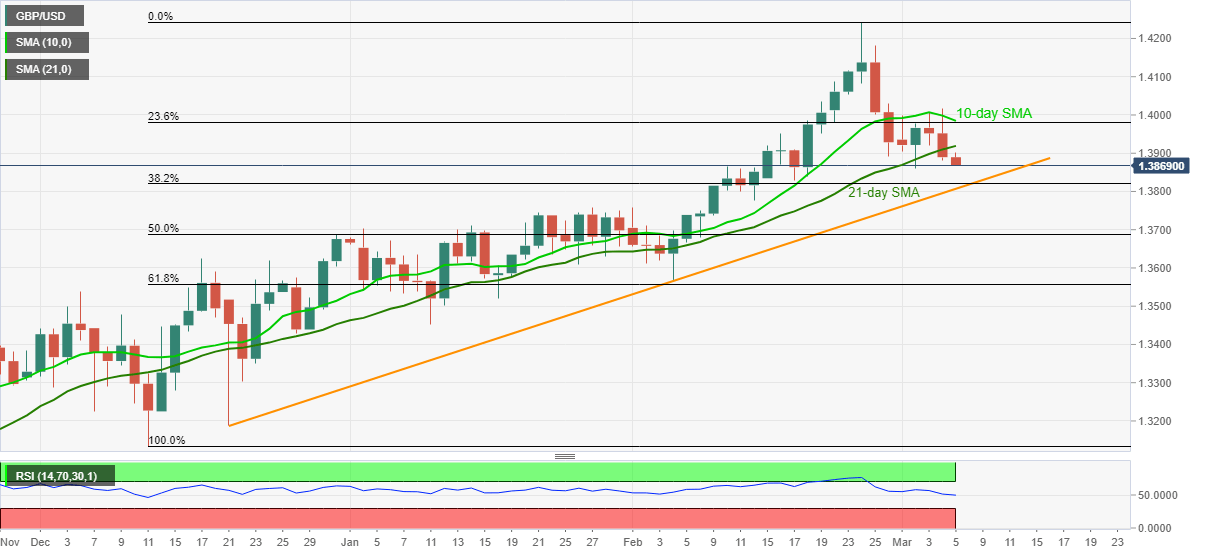
- Repeated failures to cross 10-day SMA, downside break of 21-day SMA favor sellers.
- January tops, key Fibonacci retracement levels lure the bears below the key support line.
GBP/USD bears attack weekly low while refreshing the intraday bottom with 1.3867, down 0.12% on a day, during Friday’s Asian session. In doing so, the cable extends weakness below 10-day SMA after breaking 21-day SMA the previous day.
Given the downward sloping RSI line, GBP/USD is ready to refresh the weekly low and extend the latest declines towards an ascending support line from December 21, 2020, at 1.3807 now.
However, January’s top near 1.3760-55 will challenge the quote’s further downside below the key support line, if not then 50% and 61.8% Fibonacci retracement levels of December 2020 to February 2021 upside, respectively around 1.3690 and 1.3560, should test the GBP/USD bears.
Meanwhile, pullback moves not only need to cross the 21-day SMA level of 1.3920 but should also clear the 1.3990 level comprising 10-day SMA on a daily closing to recall the GBP/USD buyers.
It’s worth mentioning that the 1.4000 threshold adds to the upside filters.
GBP/USD daily chart
Trend: Further weakness expected