Gold Price Analysis: XAU/USD eyes $1800 support amid symmetrical triangle breakdown
- XAU/USD confirms symmetrical triangle breakdown on the 1H chart.
- RSI points south below 50.00, more losses on the cards.
- Gold trades below all major HMAs amid holidays in the US, China.
Gold (XAU/USD) is accelerating the turnaround to the downside, despite the weakness in the US dollar, as the coronavirus vaccines-driven optimism overwhelms the buyers.
The XAU bulls were banking on the US stimulus, although with a little update on the fiscal spending front, they are yielding into the bearish pressure.
The holiday-thinned trading is also seen exaggerating the down moves so far this Monday. China is closed due to the Lunar New Year break while the Americans celebrate President’s Day this Monday.
Gold Price Chart: Hourly chart
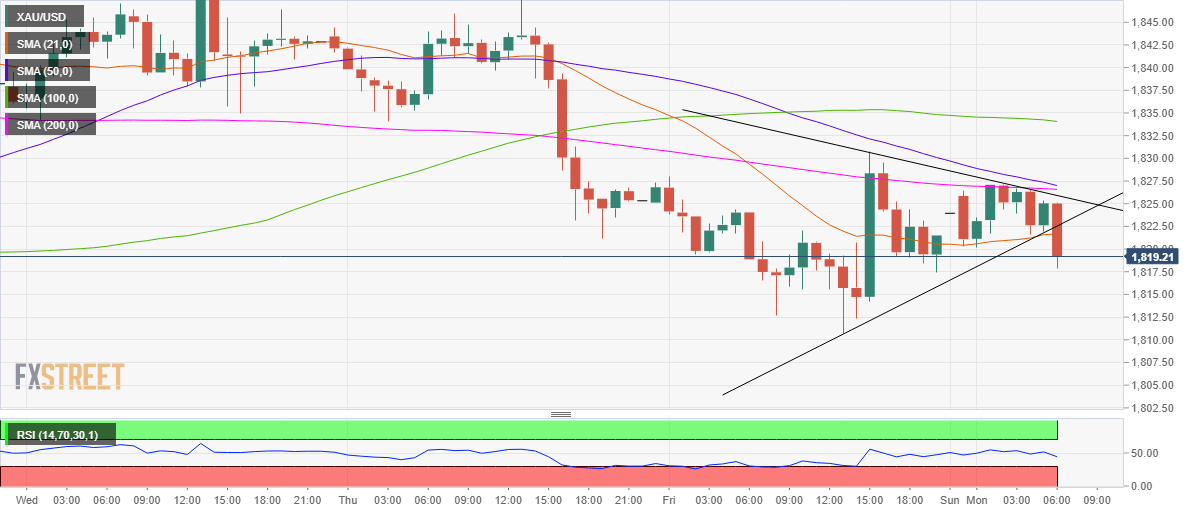
The pain in gold is also exacerbated by the technical selling, with the symmetrical triangle breakdown confirmed on the hourly sticks.
The pattern validation now targets a test of the key $1800 support, below which the February 5 low of $1792 could be tested.
The relative strength index (RSI) inches lower below the midline, currently at 43.94, backing the downside moves. Note that the chart displays an impending death cross, with the 50-hourly moving average (HMA) on the verge of piercing the 200-HMA from above.
Alternatively, any recovery attempts could meet fresh supply around $1822, which is the confluence of the pattern support now resistance and horizontal 21-HMA.
Further up, strong resistance around $1827 could limit the advances. That level is the meeting point of the pattern resistance, 50 and 200-HMAs.