Gold Price Analysis: XAU/USD stages a quick comeback, still below $1850
- XAU/USD confirms symmetrical triangle breakout on the 4H chart.
- Acceptance above 100-SMA is critical to unleashing further upside.
- 200-SMA at $1863 is the next upside target amid bullish RSI.
Gold (XAU/USD) has staged a quick comeback after meeting buyers once again around the $1833 region.
The level is the powerful confluence of the horizontal trendline support and the 200-hourly moving average (HMA).
Therefore, the bulls remain hopeful so long as that level is defended. In case of a failure to do so, the next relevant support is seen at the bullish 100-HMA of $1829.
A sharp sell-off cannot be ruled towards $1800 if the selling pressure intensifies.
While to the upside, the XAU bulls have recaptured the critical hurdle at $1841, which is the convergence of the horizontal 21 and 50-HMAs.
The buyers now aim for the $1850 psychological level once again, above which the multi-day tops of $1856 could be put to test.
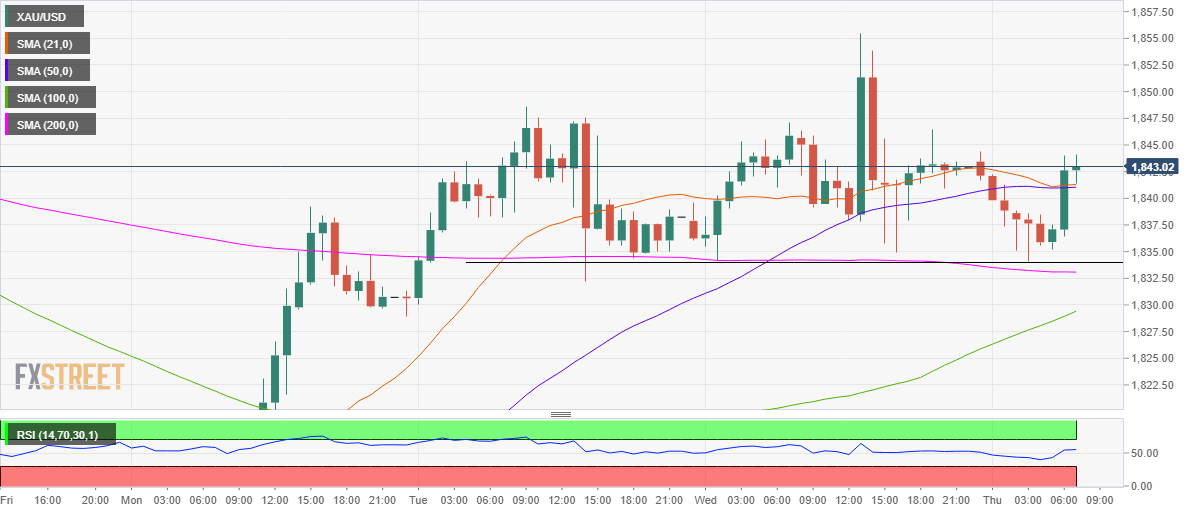
The Relative Strength Index (RSI) has turned flat but sustains above the midline, allowing room for additional recovery.
Gold Price Chart: Hourly chart
Gold Additional levels