Silver Price Analysis: XAG/USD extends break of two-week-old trend line above $25.00
- Silver remains positive after breaking previous resistance line on Tuesday, recently refreshed weekly top.
- Key SMA hurdles probe bulls, 61.8% Fibonacci retracement , one-week-old support line can challenge the sellers.
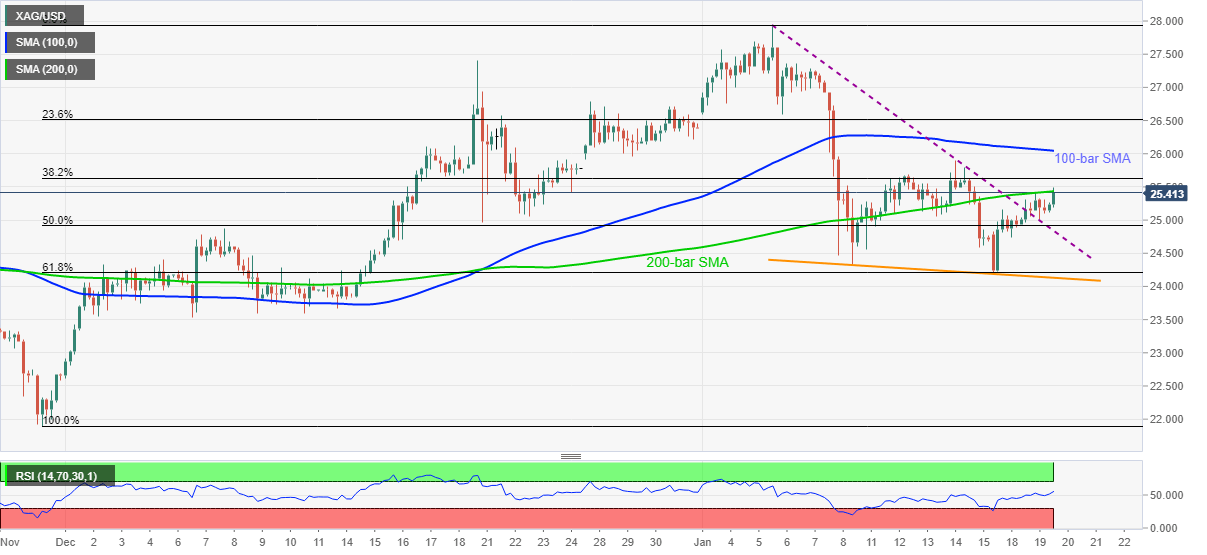
Silver refreshes weekly top to $25.48, currently up 0.90% around $25.40, during early Wednesday. The white metal broke a downward sloping trend line from January 06 the previous day but is currently battling the 200-bar SMA amid normal RSI conditions.
Given the commodity’s sustained break of prior resistance, silver is likely to cross the 200-bar SMA level near $25.50.
Following that, 100-bar SMA level of $26.05 and December-end tops near $26.60/65 can test the silver bulls ahead of directing them to the multi-day high of $27.92 and the $28.00 threshold.
On the flip side, a downside break below the immediate support line around $24.85 will highlight the $24.20/10 support zone comprising the 61.8% Fibonacci retracement of late-November 2020 to the early January 2021 upside and a descending trend line from January 11.
In a case where the bullion declines below $24.10, multiple supports around $23.60 can entertain silver sellers.
Silver four-hour chart
Trend: Bullish