Gold Price Analysis: XAU/USD battles 50-HMA on the road to recovery
- Gold consolidates Monday’s sharp drop to $1855.
- 50-HMA challenges the recovery mode after the bearish crossover.
- Bullish RSI keeps the buyers hopeful in the near-term.
Gold (XAU/USD) witnessed good two-way businesses on Monday, as traders danced to the tune of the optimism on the agreement of a US stimulus deal in the first half of the day.
Meanwhile, in the latter part of the day, gold slumped nearly $50 from weekly tops of $1907 to $1855 levels on the narrative of a new covid strain found in the UK, which fuelled heavy risk aversion across the board and pumped the greenback against its major rivals.
Gold Price Chart: Hourly
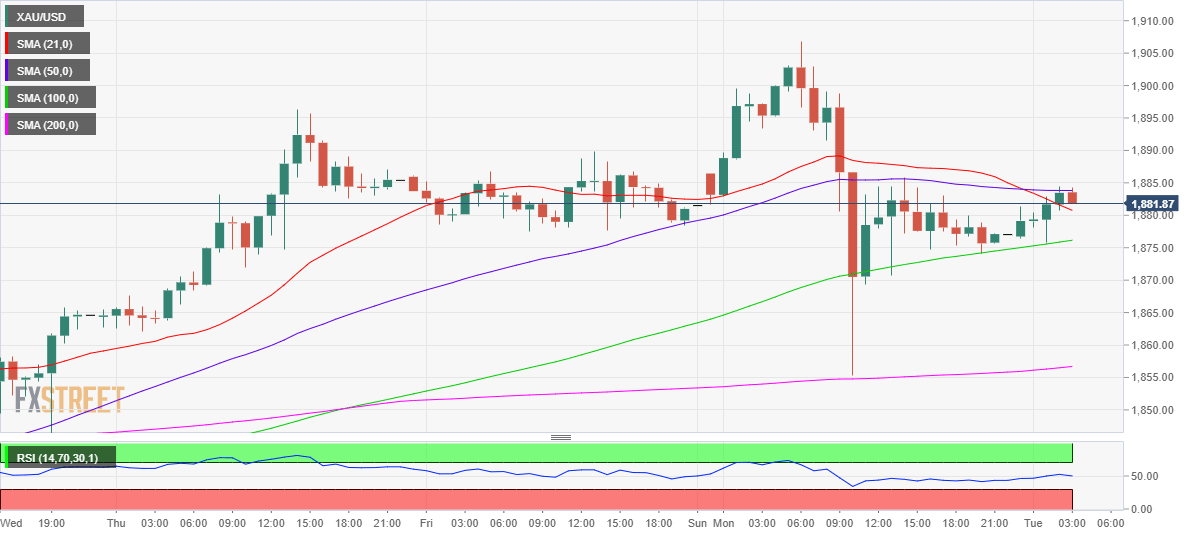
Looking at the hourly chart, gold is trying hard to extend the overnight recovery, facing stiff hurdle at the horizontal 50-hourly moving average (HMA) at $1884.
The bearish crossover spotted on the said timeframe is likely capping the upside attempts in the spot. The 21-HMA crossed the 50-HMA from above post-Tokyo open.
The immediate support is seen at the 21-HMA, now at $1880, below which the upward-sloping 100-HMA at $1876 could be tested. Further south, the critical 200-HMA at $1856 will be a tough nut to crack for the bears.
On the flip side, the Relative Strength Index (RSI) still holds above the midline, keeping the bias for a rebound intact.
Acceptance above the 50-HMA barrier could expose the $1900 level. The next resistance awaits at Monday’s high of $1907.
Gold Additional levels