USD/INR Price New: Indian rupee hits five-month tops, eyes 73.00
- USD/INR charts bear flag breakdown on 15-minutes chart.
- The spot looks to test the 73 support in the coming days.
- Dollar supply, foreign inflows into Indian equities weigh.
USD/INR falls for the third straight session on Friday, hitting the lowest levels since March 2020 at 73.28.
The sell-off in the spot is mainly driven by the relentless bearish pressure seen on the US dollar against its main peers after the Fed Chair Powell announced a new monetary policy framework to to ensure economic recovery and job creation.
Further, the surge in the foreign fund inflows into the Indian equity markets boosted the rupee, exacerbating the pain in the cross.
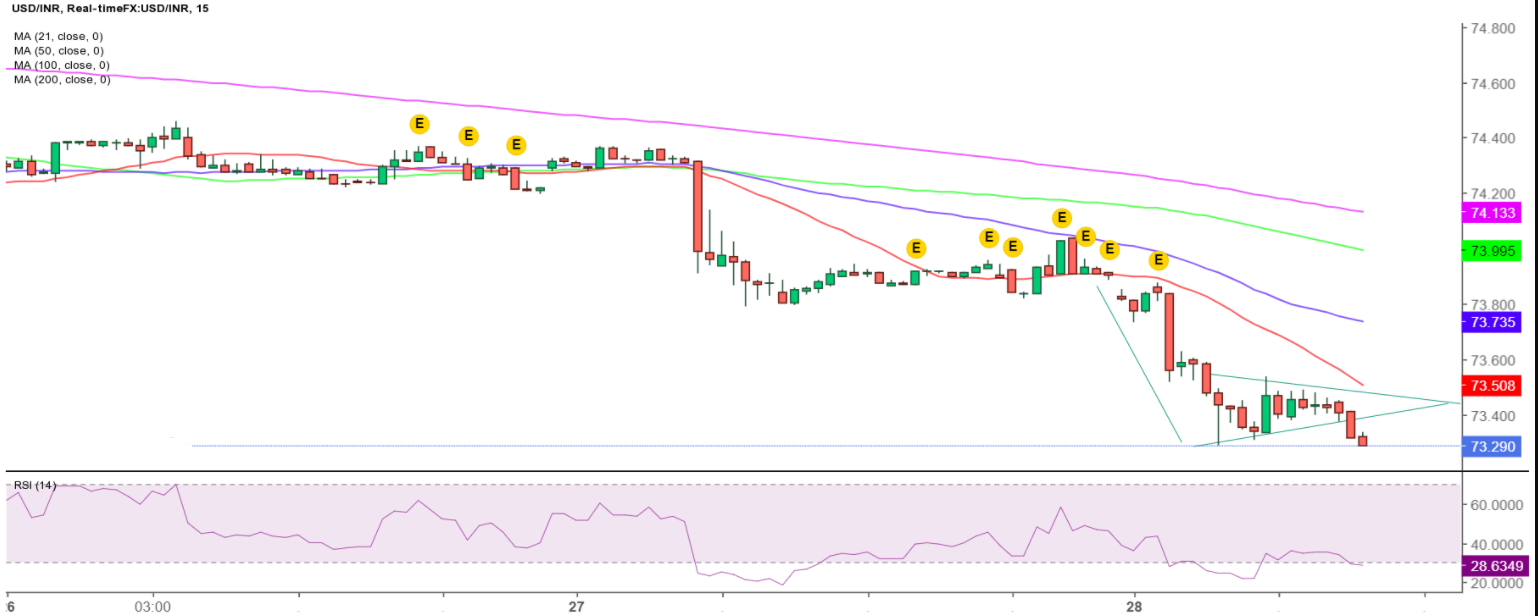
As observed in the 15-minutes chart, a bear flag formation is confirmed after USD/INR broke below the rising trendline (pattern) support at 73.38.
The bearish breakdown opens floors for a test of the pattern target at around 72.80 levels in the coming days. Ahead of that level, the sellers will aim for the 73 mark.
The Relative Strength Index (RSI) has bounced-off the oversold region, although holds in the bearish territory below 50.00. This indicates that there is more room to the downside.
Alternatively, any pullback could face stiff resistance at 73.50, the confluence of the bearish 21-Simple Moving Average (SMA) on the 15-minutes chart and the pattern’s upside barrier.
Should the bulls manage to recapture the latter, a test of the 50-SMA at 73.73 cannot be ruled out.
USD/INR: 15-minutes chart

USD/INR: Additional levels
