GBP/CAD Price Analysis: Battle lines well-drawn within a falling channel
- GBP/CAD remains trapped between two key SMA on the 4-hour chart.
- The cross attempts a bounce, as RSI looks to regain the 50 level.
- Range play to remain intact ahead of BOE-speak, virus updates.
Following the Asian drop below 1.7050, GBP/CAD is attempting a tepid bounce from a daily low of 1.7010 ahead of the European open.
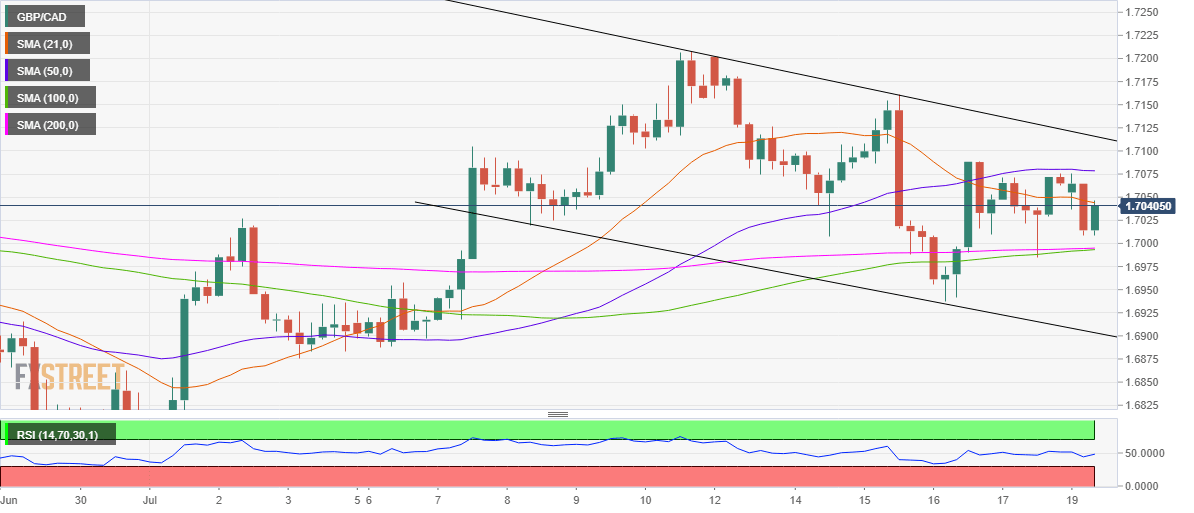
The latest uptick could be associated with the Relative Strength Index (RSI) on the four-hour (4H) chart witnessing an upturn, as it looks to pierce through the 50 level from the current 48.65 levels.
As observed in the chart, the price continues to hold above the powerful support at 1.6994, which is the confluence of the 100 and 200-4H Simple Moving Averages (SMA), while ranging within a falling channel since early July.
A break below that support will intensify the bearish pressure, with sellers aiming the falling trendline support at 1.6903.
Meanwhile, the immediate upside remains capped by the downward sloping 21-4H SMA at 1.7050. An hourly closing above the latter will open doors towards the crucial horizontal resistance of the 50-4H SMA at 1.7078. The near-term bullish bias could likely get revived only above that level.
GBP/CAD: 4-hour chart