Back
14 Jul 2020
EUR/USD Price Analysis: Bulls seeking a break of top side critical structure
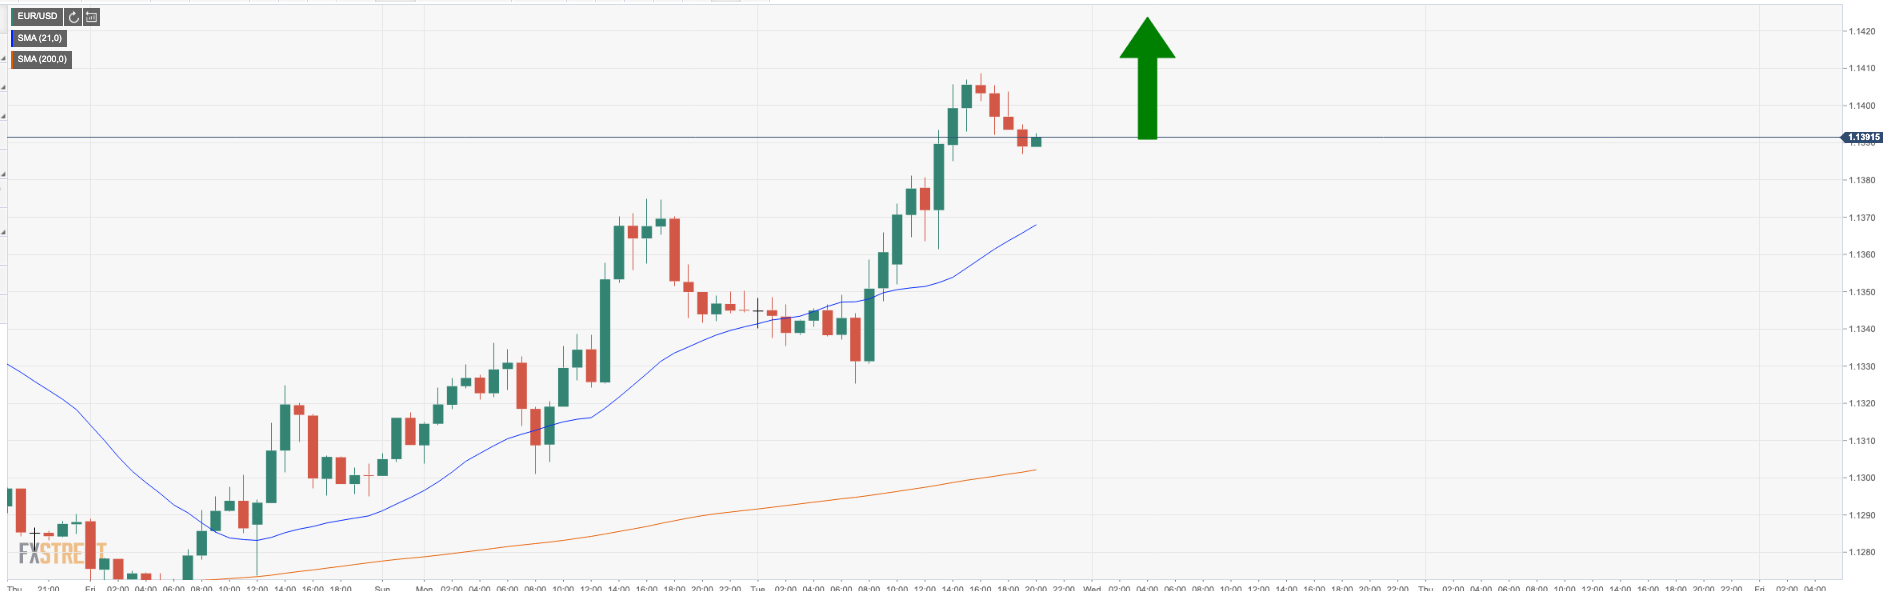
- EUR/USD bulls remain in control while above a 21 moving average on the shorter time frames.
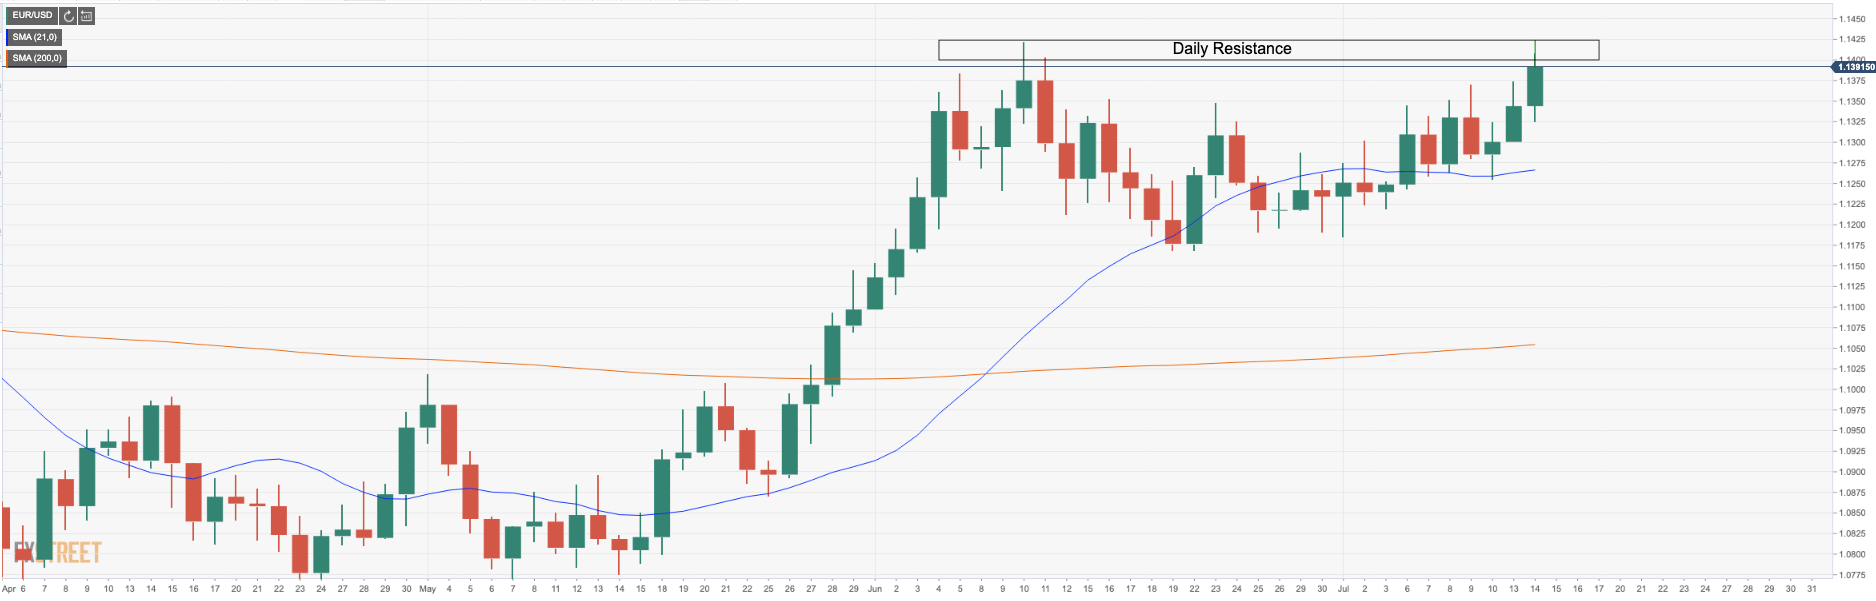
- Daily resistance, is, however, reinforced by longer-term structure.
EUR/USD is showing signs of a bullish nature, although the price is likely to struggle as daily highs and weekly/monthly structure.
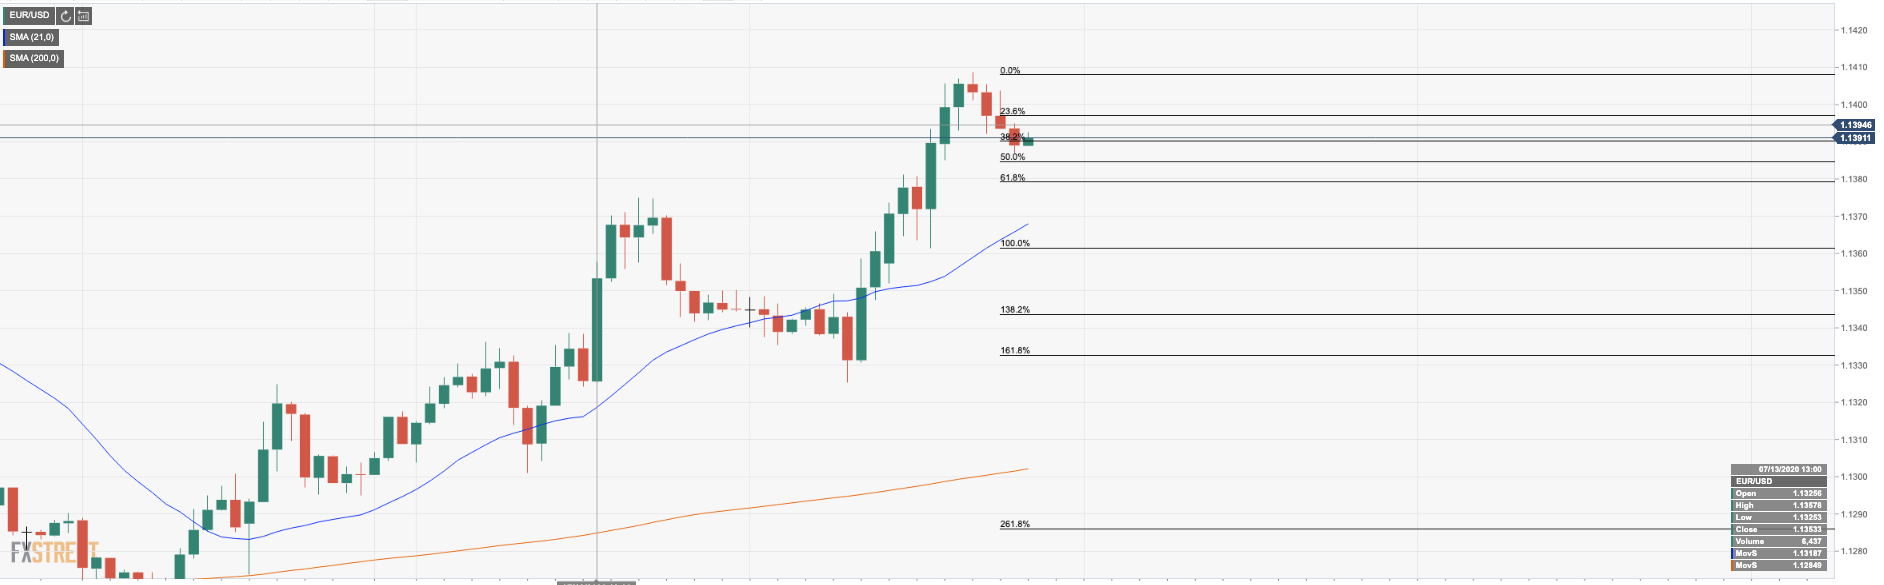
On the hourly time frame, as per the first chart, we can see that there has been a correction of a significant degree which could start to attract an accumulation of bids in order to push the price into another bullish impulse.
Hourly chart
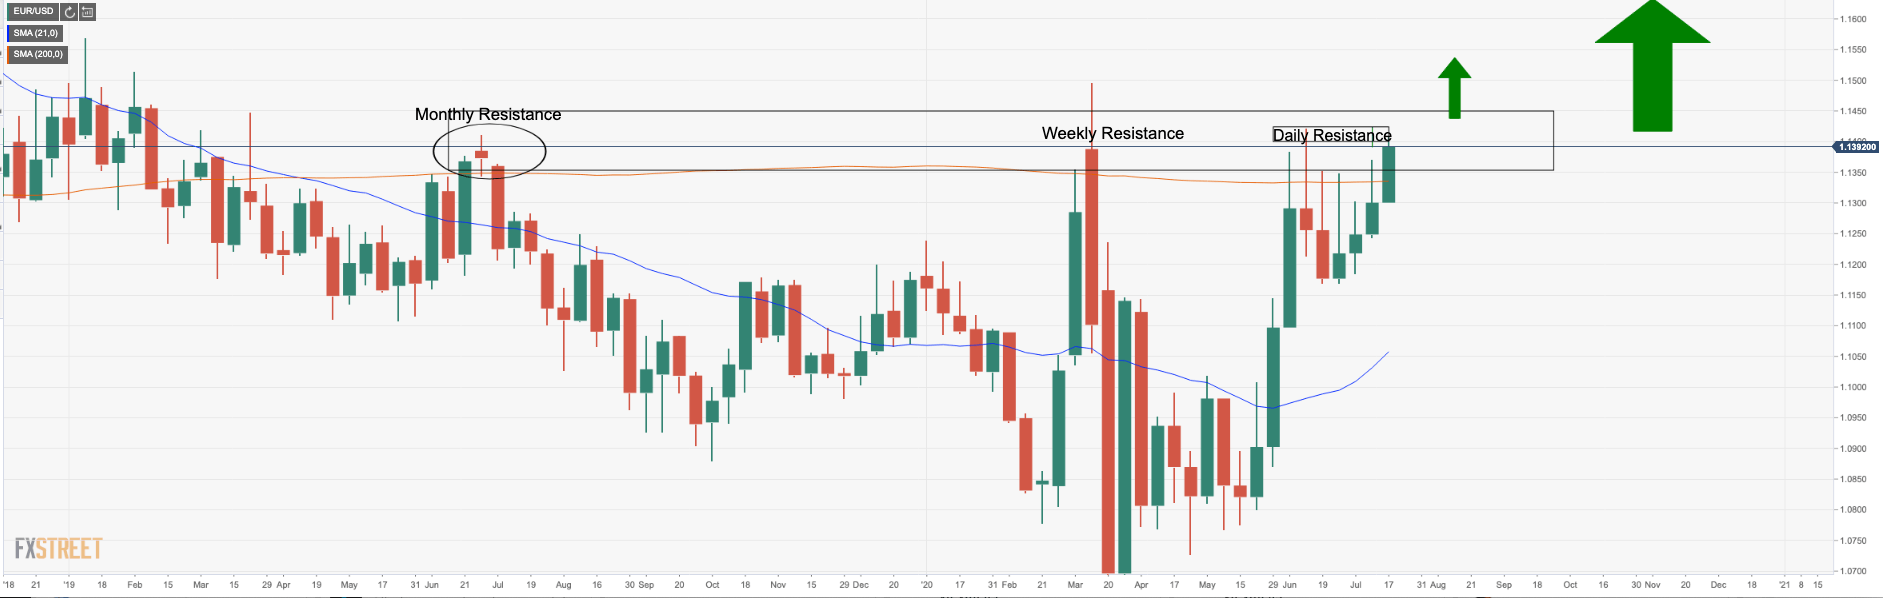
However, there is a tough structure that the bulls will need to break through in the daily chart:
Daily structure
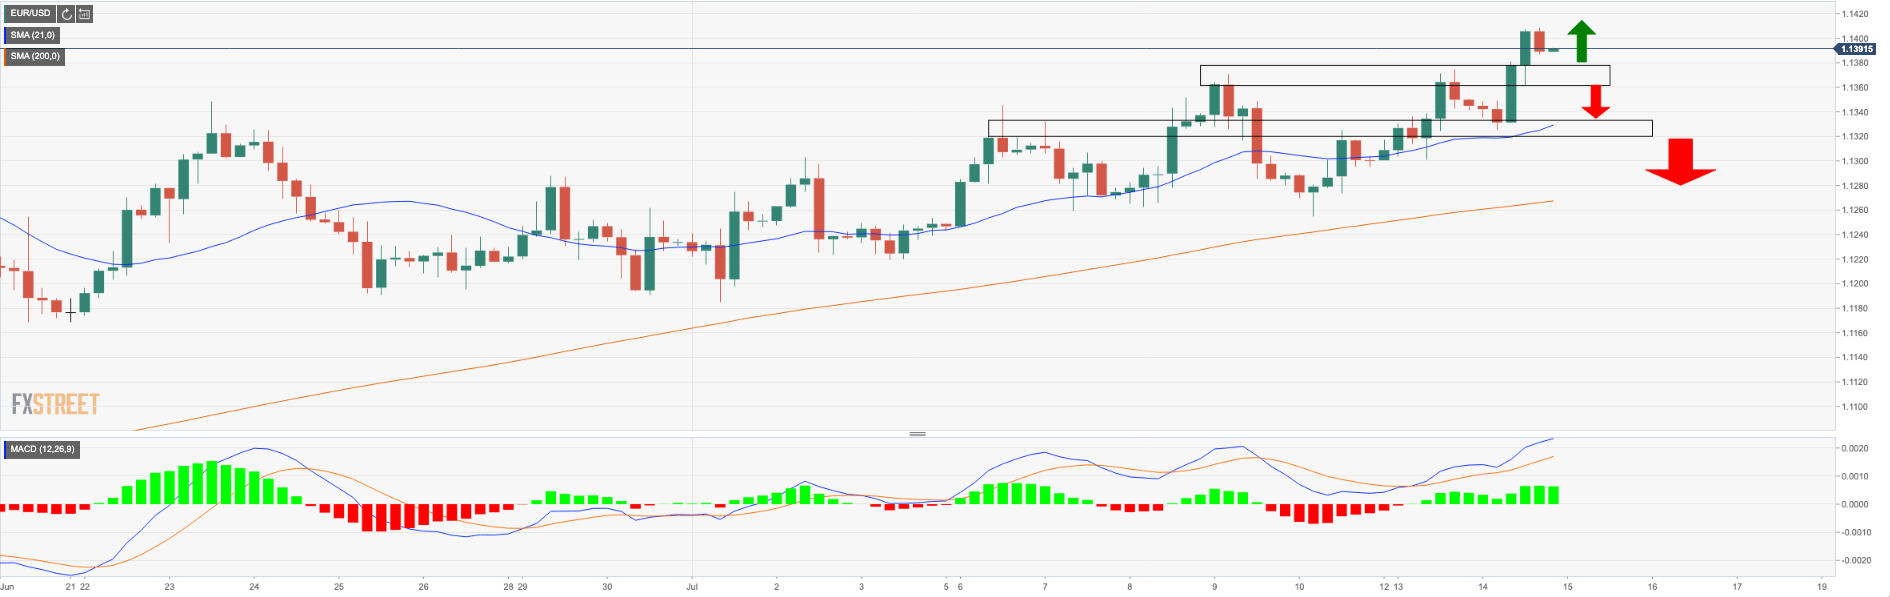
On a break of the structure, it is blue skies:
Failures to break through the top side opens risk of a re-run to the downside.
However, while above the 21 moving average with MACD bullish, there are no confirmations that the Bulls are done yet.