EUR/USD Price Analysis: Signs of indecision near 1.12
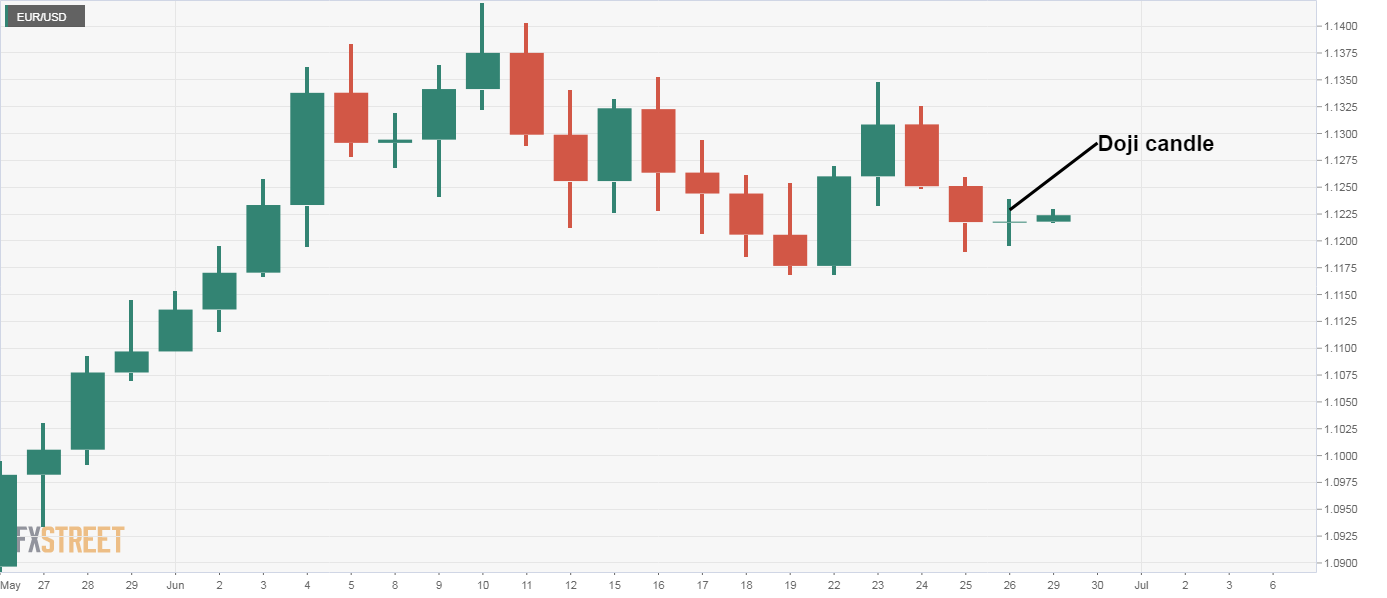
- EUR/USD created a Doji candle on Friday, a sign of indecision in the market.
- Friday's high is the level to beat for the bulls.
EUR/USD defended the psychological support of 1.12 for the second consecutive day on Friday and is currently trading around 1.1220.
The pair formed a Doji candle on Friday, signaling indecision in the market place. A close above Friday's high of 1.1239 would confirm a bullish reversal Doji pattern and open the doors for re-test of the June 10 high of 1.1422.
On the way higher, the pair may encounter resistance at 1.1332 (200-week simple moving average). The shared currency has failed to keep gains above that average multiple times in the last four weeks. As a result, acceptance above 1.1332 is needed to restore the overall bullish trend from lows near 1.07 observed in April.
Meanwhile, a close under Friday's low of 1.1195 would imply a continuation of the sell-off from the June 23 high of 1.1349 and may yield a drop to 1.1033 (200-day simple moving average).
Daily chart
Trend: Neutral