EUR/USD Price Analysis: Euro's pullback takes the shape of a falling wedge
- EUR/USD has created a falling wedge pattern on the 4-hour chart.
- A move above 1.13 is needed to confirm bullish breakout.
EUR/USD is down but not out. The pair is currently trading at 1.12, representing a 0.5% decline on a week-to-date basis, having put in a multi-month high of 1.1422 earlier this month.
The pullback, however, has taken the shape of a falling wedge pattern, as seen in the 4-hour chart. A falling wedge comprises converging trendlines connecting lower highs and lower lows. The converging nature of trendlines indicates bearish exhaustion. Hence, a breakout is considered a sign of bullish reversal.
As of writing, the upper end of the wedge is located at 1.13. A move through that level would confirm a wedge breakout and open the doors to re-test of the recent high of 1.1422. However, acceptance under 1.1175 (38.2% Fib retracement of 1.0775/1.1422) would confirm a short-term bullish-to-bearish trend change and will likely yield a sell-off to 1.1027 (200-day simple moving average).
4-hour chart
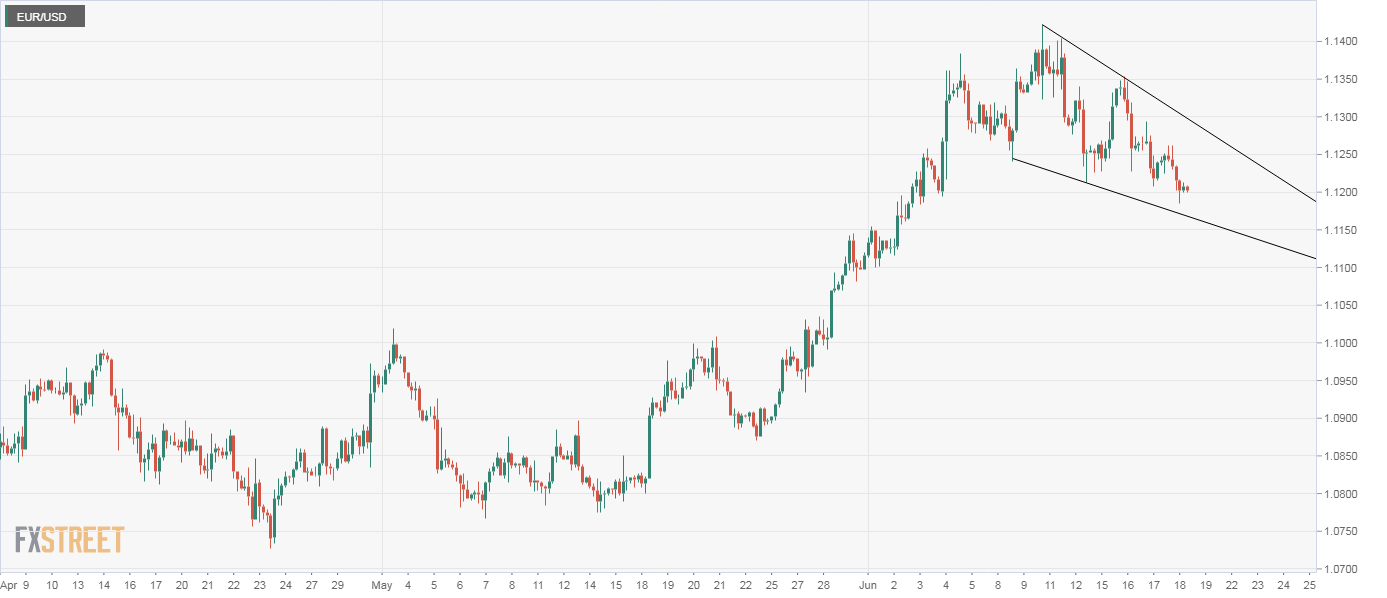
Trend: Bullish above 1.13