Back
9 Jun 2020
US Dollar Index Price Analysis: Some consolidation looks likely
- DXY has so far met decent contention in the 96.50 region.
- Further south now emerges the Fibo retracement at 96.03.
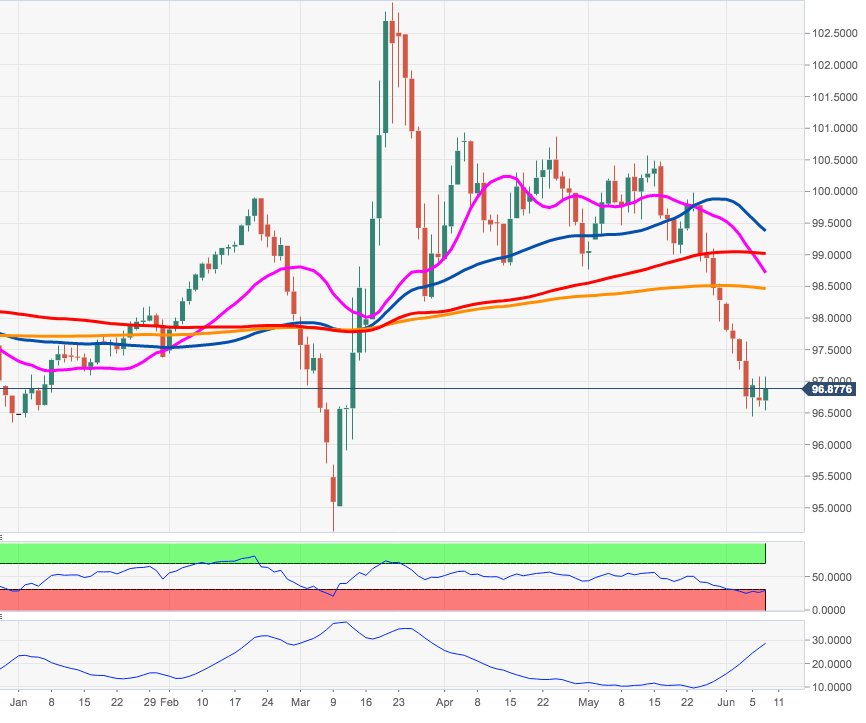
The sharp sell-off in DXY looks to have found strong support in the mid-96.00s for the time being.
The index is now looking to stabilize at current levels, although a sustainable breakout of the 97.00 barrier still remains elusive.
In case the dollar manages to gather upside traction, the Fibo retracement (of the 2017-2018 drop) at 97.87 should offer interim resistance. If the selling bias resumes, then the focus of attention is expected to shift to the 96.00 neighbourhood, where sits another Fibo retracement.
DXY daily chart