GBP/USD Price Analysis: Recovers from short-term falling wedge support above 1.2200
- GBP/USD extends pullback from the five-week low.
- Buyers will look for a confirmation of the bullish pattern for fresh entries.
- Sellers can aim for the key Fibonacci retracement supports during a fresh downside.
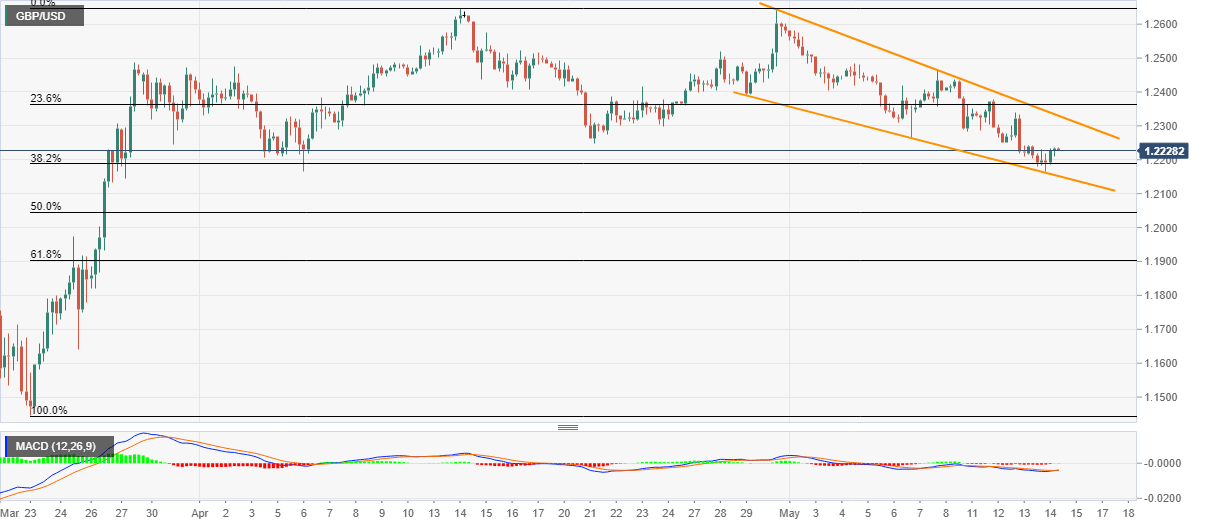
GBP/USD escalates the previous day’s recovery moves to 1.2238, up 0.08% on a day, as Tokyo opens for trading on Friday. The pair bounced off the support line of the short-term falling wedge technical formation on Thursday.
While the Cable’s recent recoveries direct it towards the bullish pattern’s resistance line near 1.2330, further upside depends upon how well the buyers manage to dominate beyond that level.
During the successful break of 1.2330, 1.2465 and 1.2500 can entertain the optimists ahead of pushing them to the April monthly high near 1.2645.
Alternatively, a downside break of the said support line, at 1.2150 now, can fetch the quote towards 50% and 61.8% Fibonacci retracement levels of the pair’s March-April run-up, respectively near 1.2045 and 1.1900.
GBP/USD four-hour chart
Trend: Pullback expected