Back
12 May 2020
US Dollar Index Asia Price Forecast: DXY slumps and trades near the 100.00 mark
- US Dollar Index (DXY) pares some of the intraday losses.
- Resistance is seen near the 100.00 level while support is near 99.60 level.
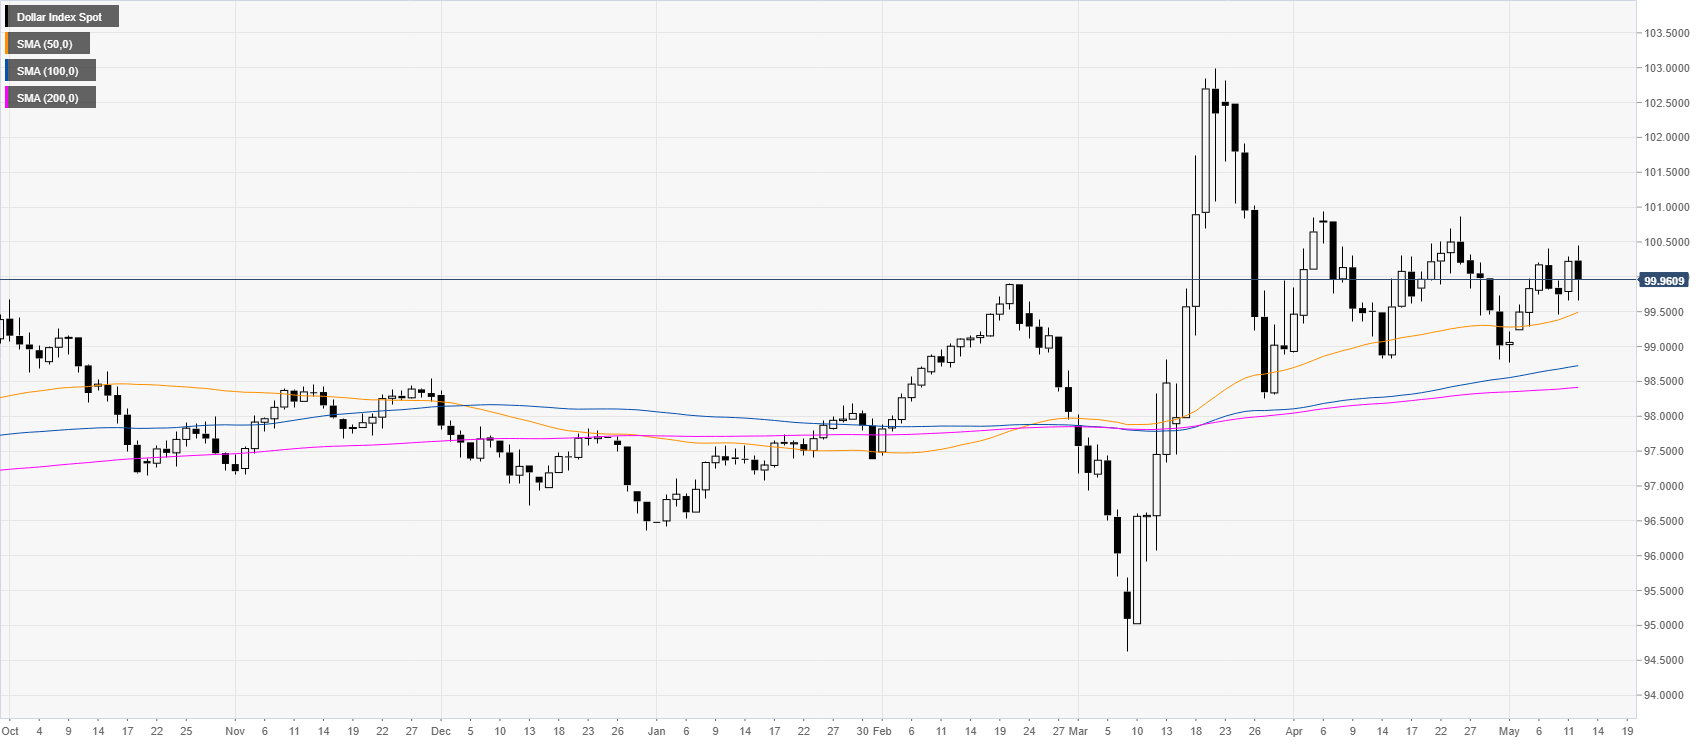
DXY daily chart
After a false break above the 100.40 level, the US Dollar Index (DXY) index is stabilizing near the 100.00 mark while trading above the main SMAs on the daily time-frame suggesting a bullish bias.
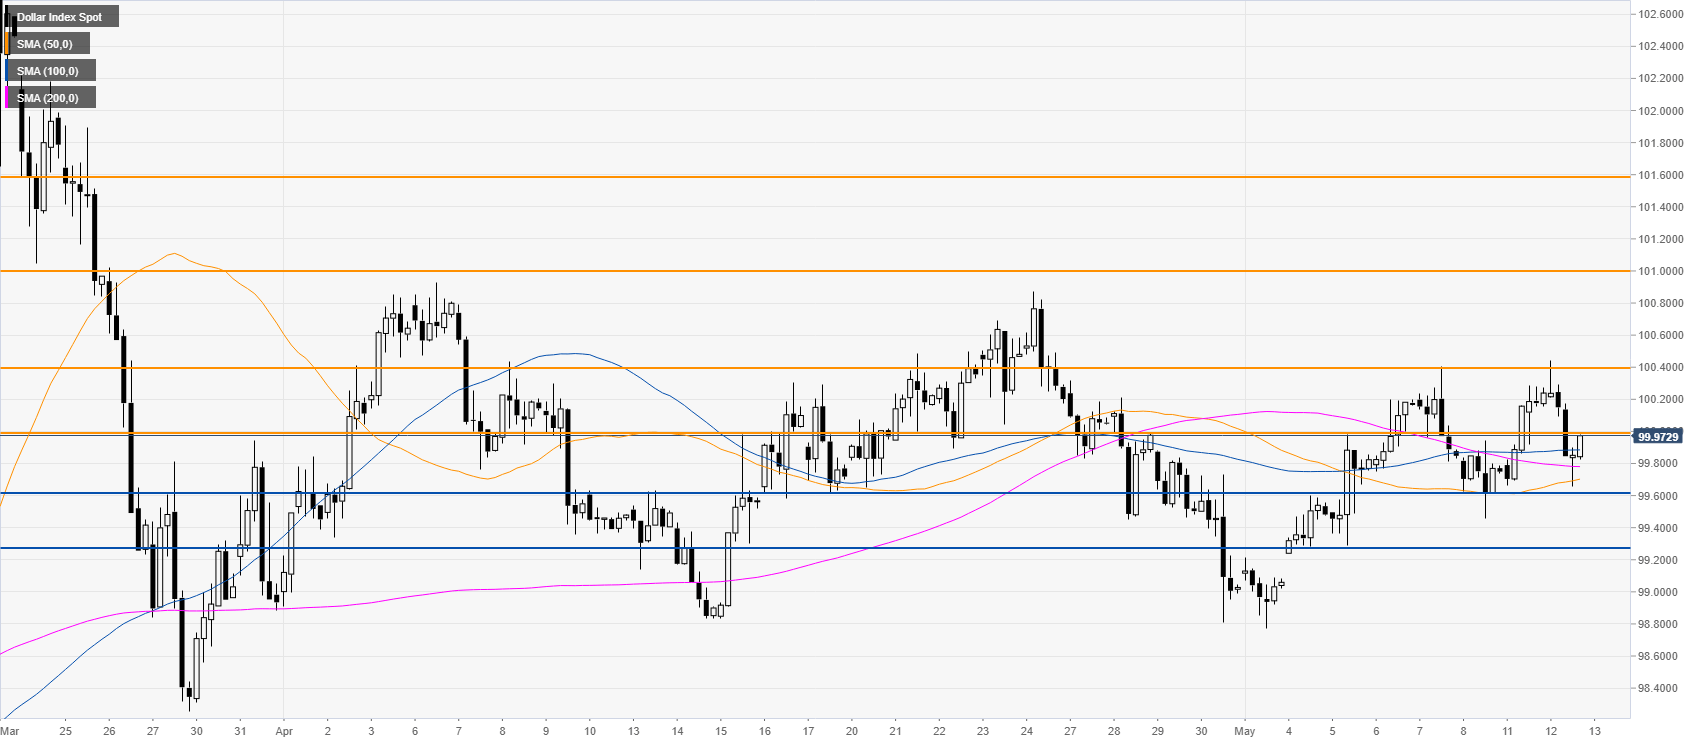
DXY four-hour chart
Despite the drop seen on Tuesday, DXY is still holding above the main SMAs on the four-hour chart confirming bullish momentum. The first hurdle for buyers will be the 100.00 mark resistance followed by the 110.40 level. On the flip side, bears will likely intervene on a break below the 99.60 level en route towards the 99.30 level.
Additional key levels