Back
22 Apr 2020
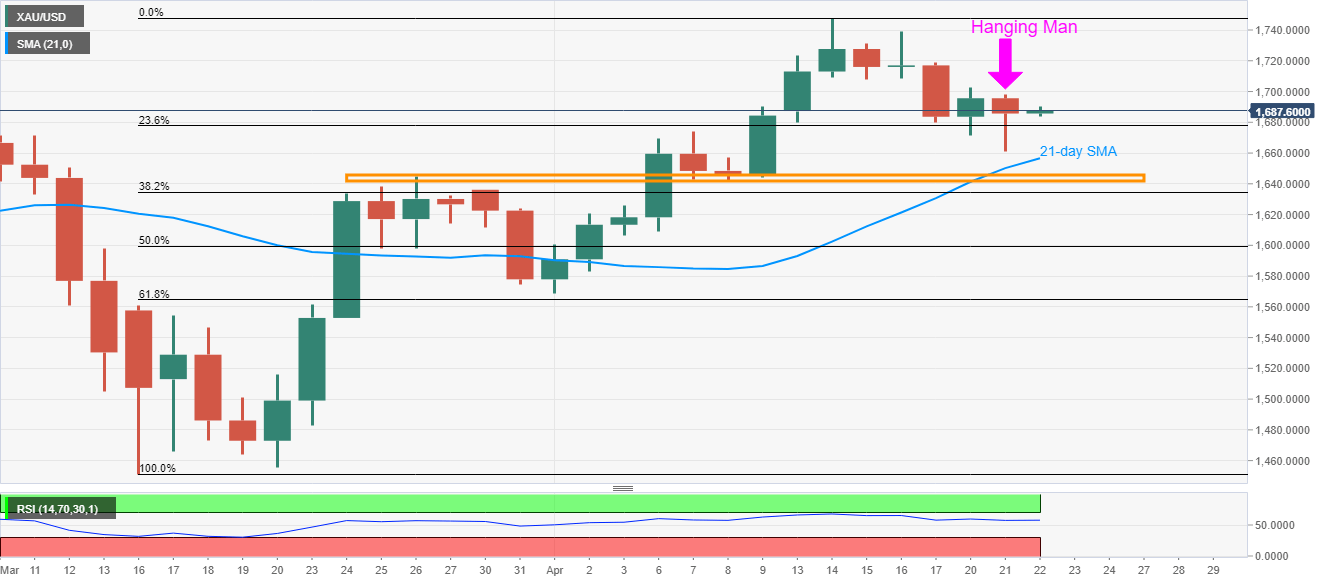
Gold Price Analysis: Hanging Man on D1 suggests buyers stepping back below $1,700
- Gold prices consolidate losses after flashing a bearish candlestick formation the previous day.
- 21-day SMA offers immediate support ahead of $1,645/40 area.
- $1,700 guards immediate upside.
Gold prices register modest gains of 0.15% to $1,689 amid the Asian session on Wednesday. That said, the bullion portrayed “Hanging Man”, a bearish candlestick pattern, on the daily (D1) chart on Tuesday.
The candlestick formation shows that the buyers are losing faith in the precious metal and hence gradual declines to 21-day SMA, currently near $1,656 can’t be ruled out.
However, a horizontal area including multiple highs and lows marked from late-March, between $1,645 and $1,640, could challenge the sellers afterward.
Meanwhile, an upside daily closing beyond $1,700 will defy the bearish candlestick formation and trigger the recovery towards $1,708 ahead of challenging the monthly top close to $1,748.
Gold daily chart
Trend: Pullback expected