Back
29 Oct 2019
GBP/USD technical analysis: Cable trading at daily highs on Brexit optimism
- GBP/USD bounced sharply from the 1.2815 support on Brexit optimism.
- GBP/USD is challenging the 1.2880 resistance in the New York session.
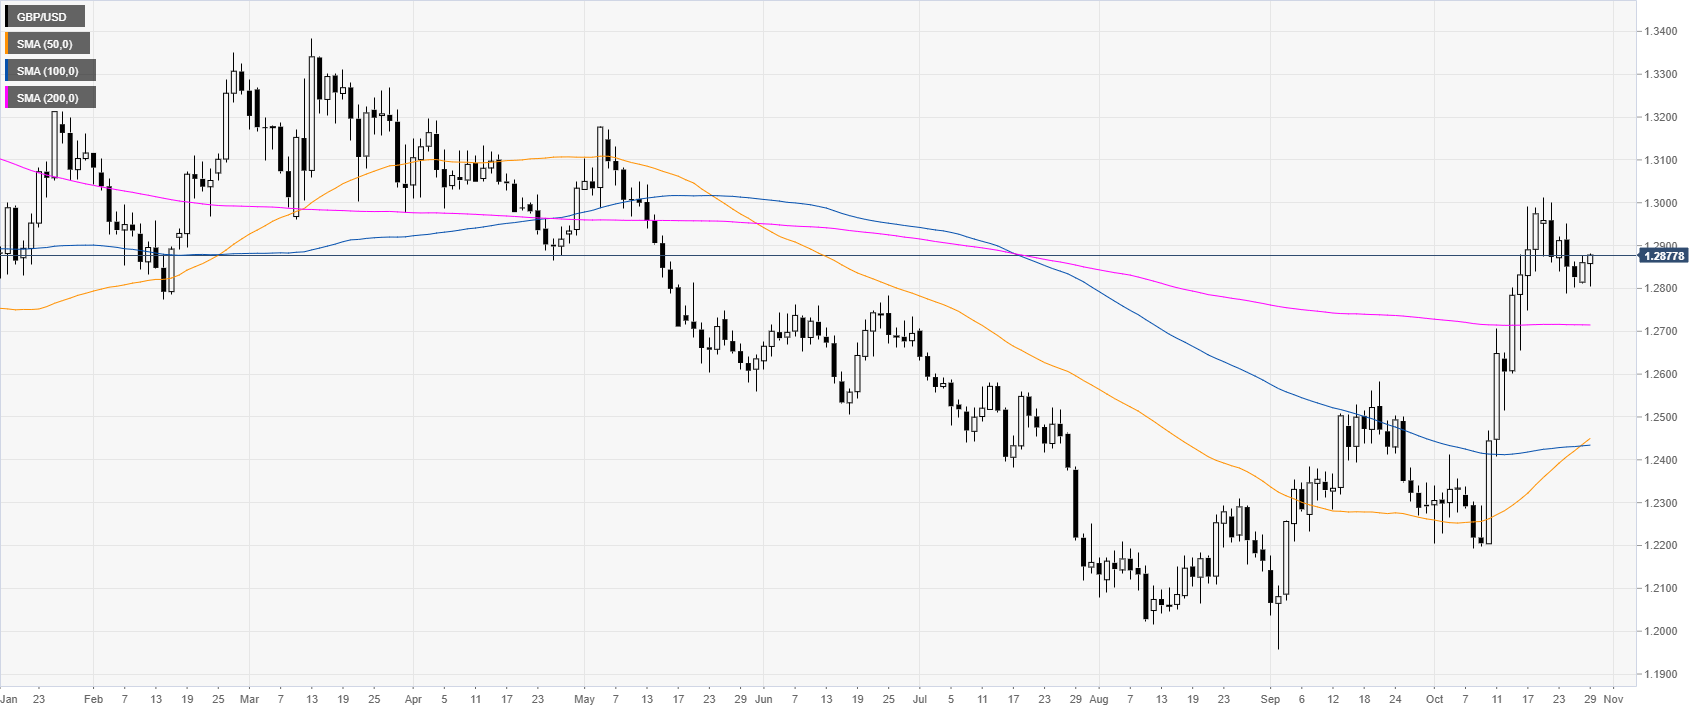
GBP/USD daily chart
The Cable in October spiked up above the main daily simple moving averages (DMAs) and hit levels not seen since mid-May 2019. It has been reported on Tuesday that the UK Labour party will join other political parties and back elections in December. The European Union has approved extending the Brexit to January 2020. The GBP liked the news and jumped.
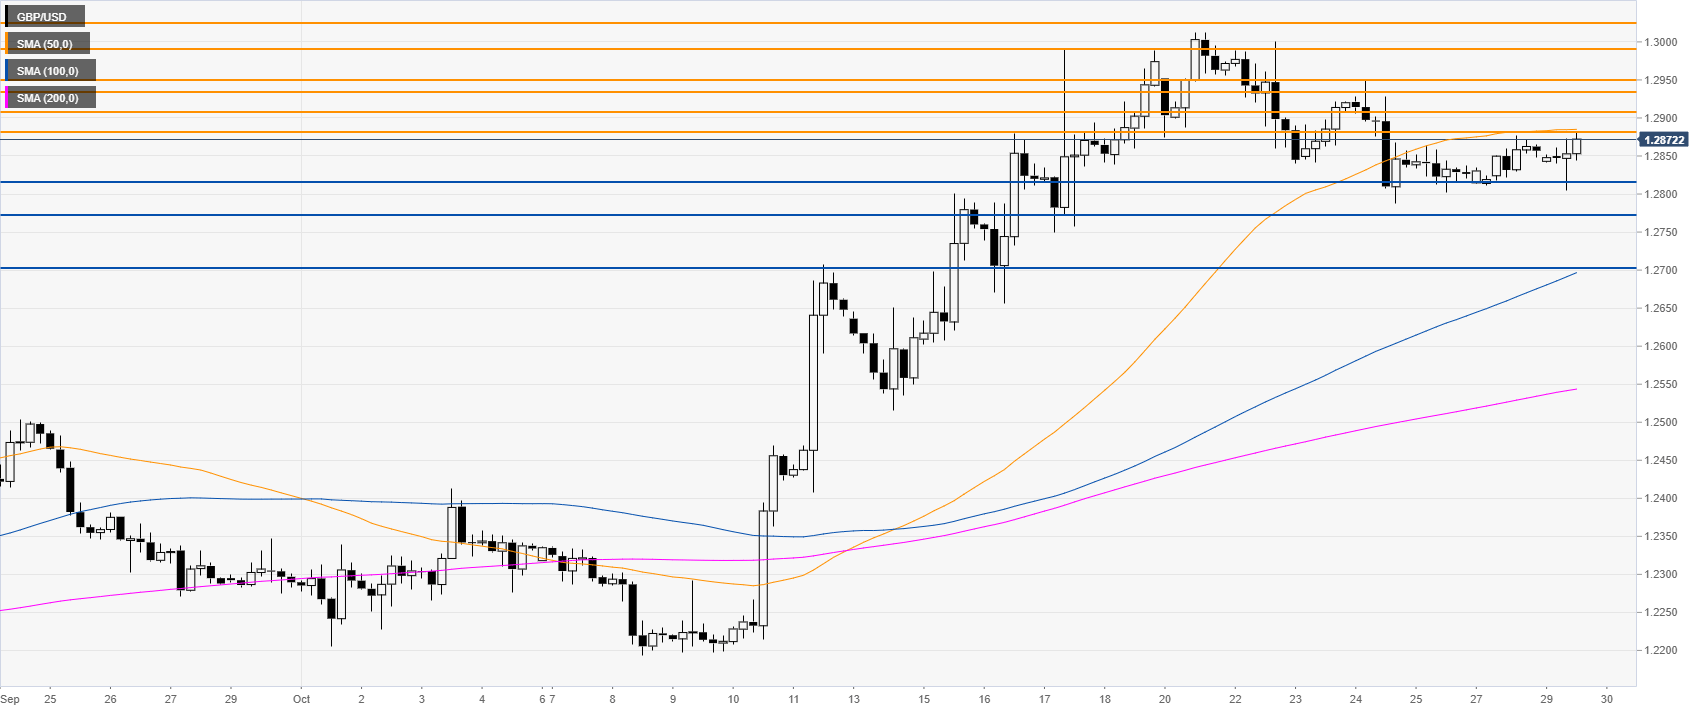
GBP/USD four-hour chart
GBP/USD is consolidating sideways below the 1.2900 handle and the 50 SMA. Once again, the spot is challenging the 1.2880 resistance near the 50 SMA. If the market can surpass that level there might be room for a retest of the 1.2950/1.3000 zone, according to the Technical Confluences Indicator.
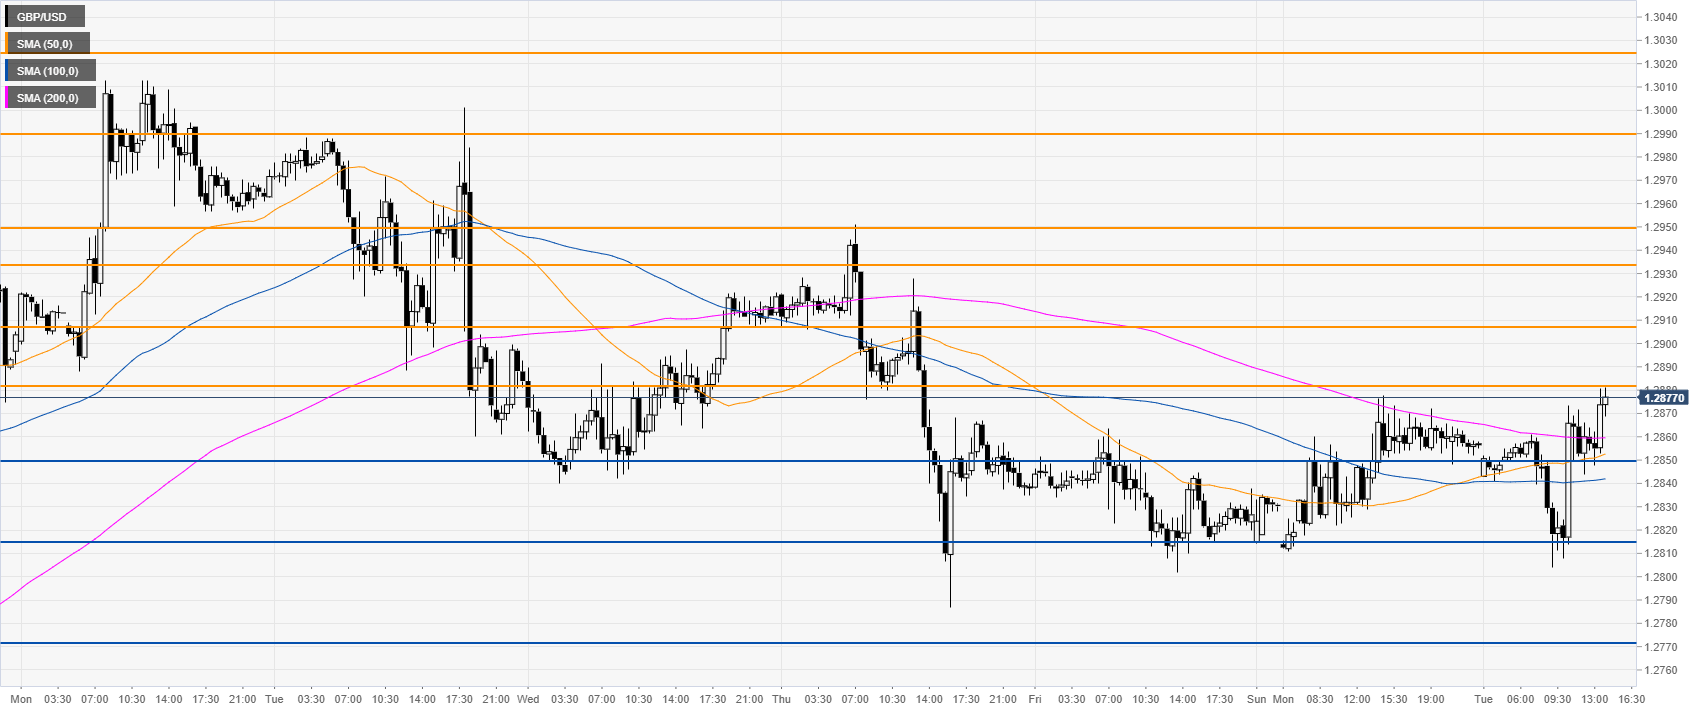
GBP/USD 30-minute chart
GBP/USD is trading above its main SMAs, suggesting bulls are picking up some steam in the near term. Support is seen at 1.2850 and 1.2815, according to the Technical Confluences Indicator.
Additional key levels