Back
8 Oct 2019
US Dollar Index technical analysis: DXY retraces to 99.10 level on Fed’s Powell speech
- The level to beat for bulls is the 99.30/99.40 resistance zone.
- Fed’s Powell speech: Policy is never on a preset course, will change as appropriate.
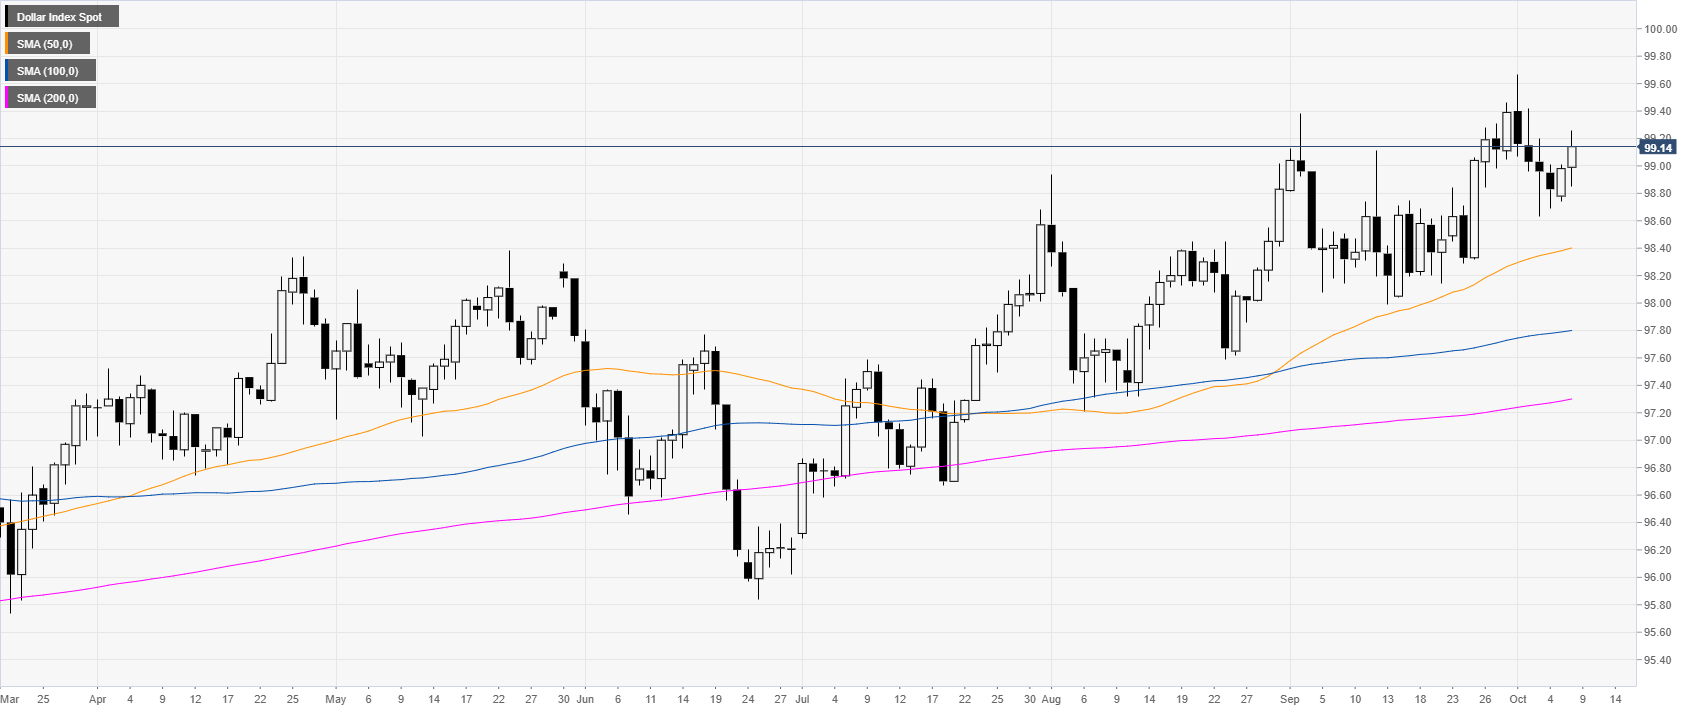
DXY daily chart
The US Dollar Index (DXY) is trading in a bull trend above the main daily simple moving averages (DSMAs). Fed’s Chairman Jerome Powell says that policy is never on a preset course, will change as appropriate.
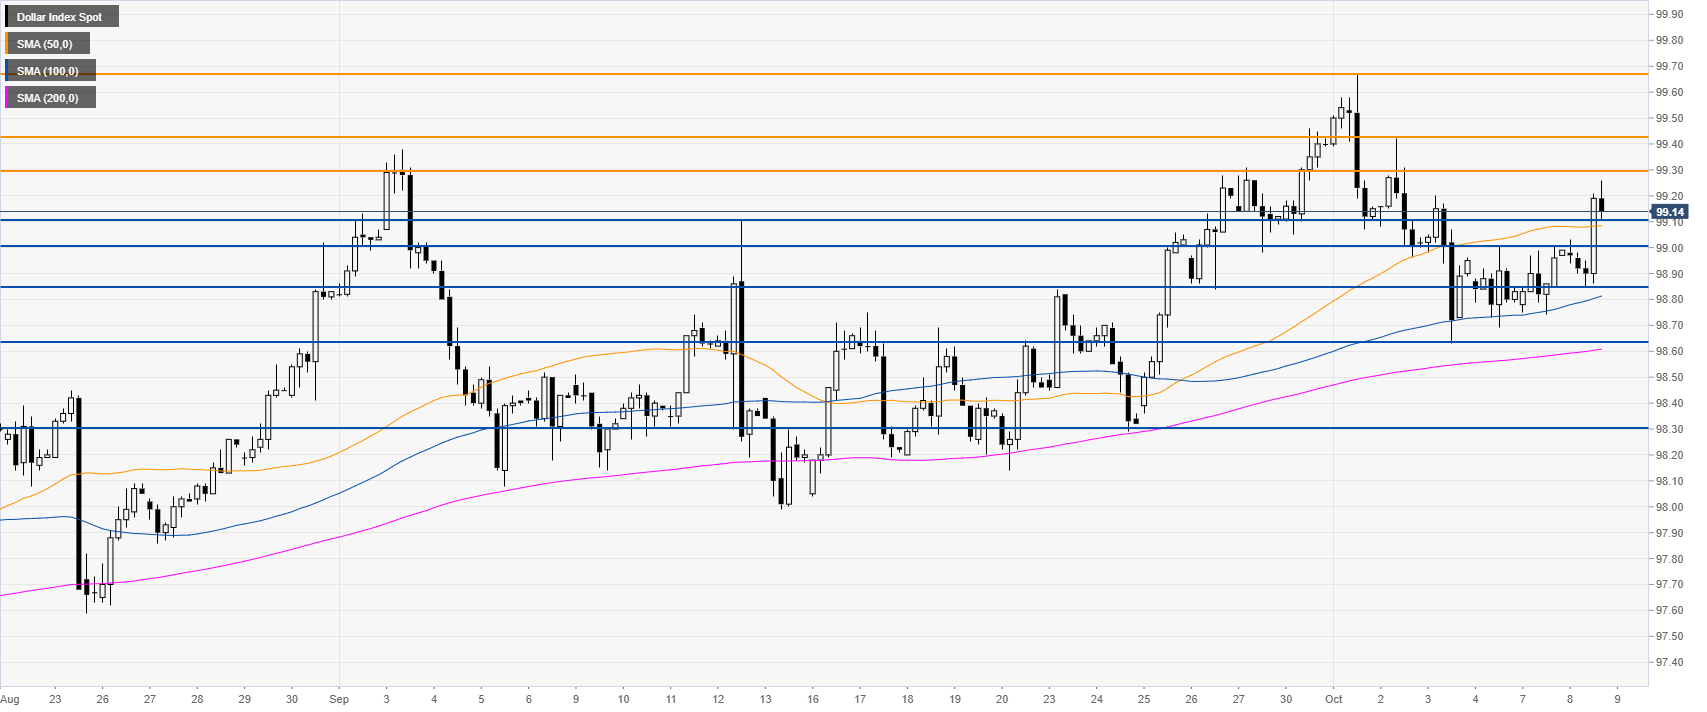
DXY four-hour chart
DXY broke above the 99.10 resistance and the 50 SMA. The Greenback has room to appreciate towards the 99.30/99.43 resistance zone in the medium term.
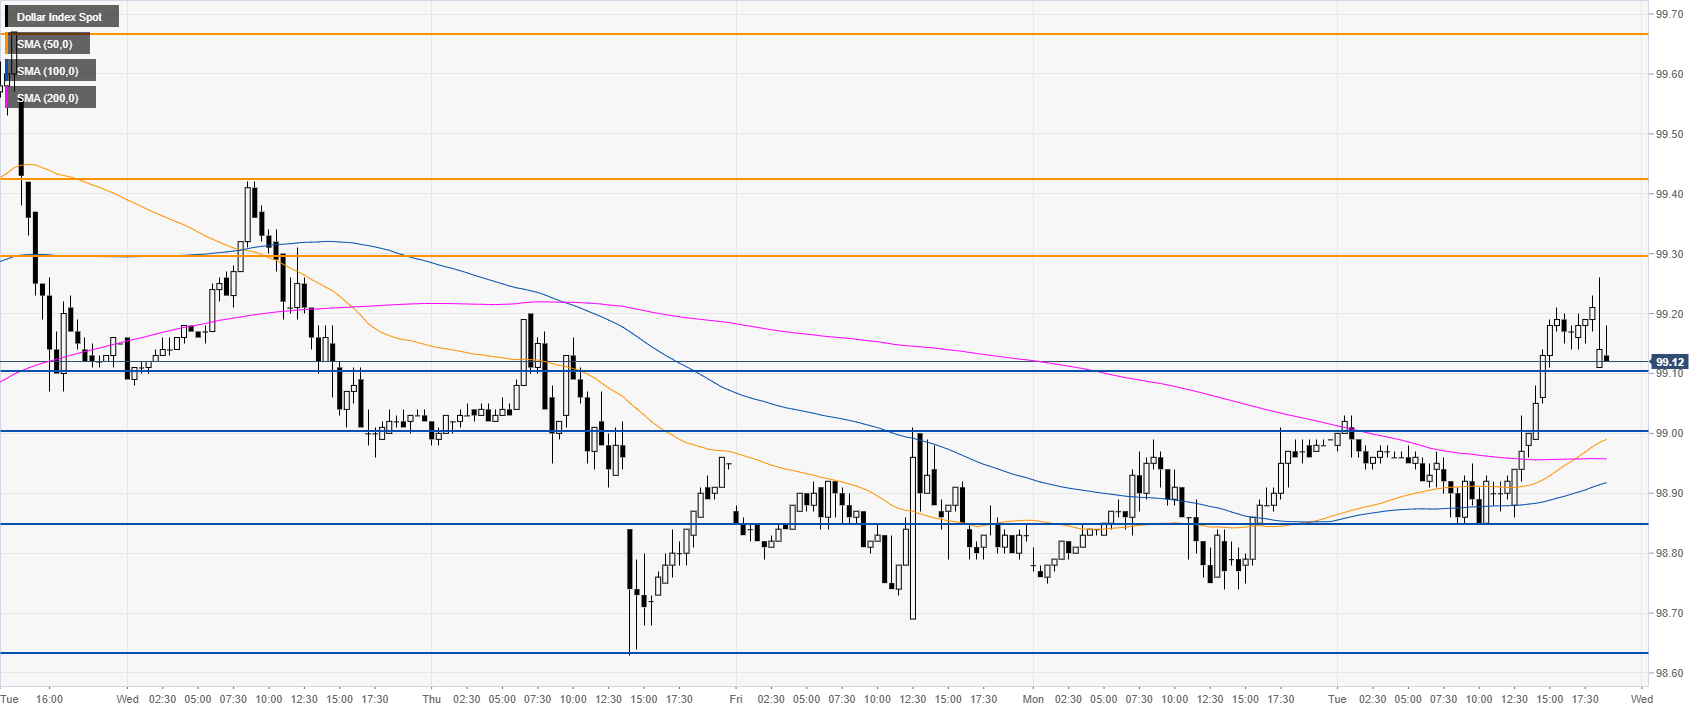
DXY 30-minute chart
DXY is trading above its main SMAs, suggesting bullish momentum in the short term. Support is seen at the 98.10/99.00 support zone.
Additional key levels