USD/CHF technical analysis: 4H 200MA, 50% Fibo. question a week-long rising channel
- USD/CHF struggles to clear 4H 200MA inside the one-week old rising channel.
- 50% Fibonacci retracement of June-August south-run adds to the resistance.
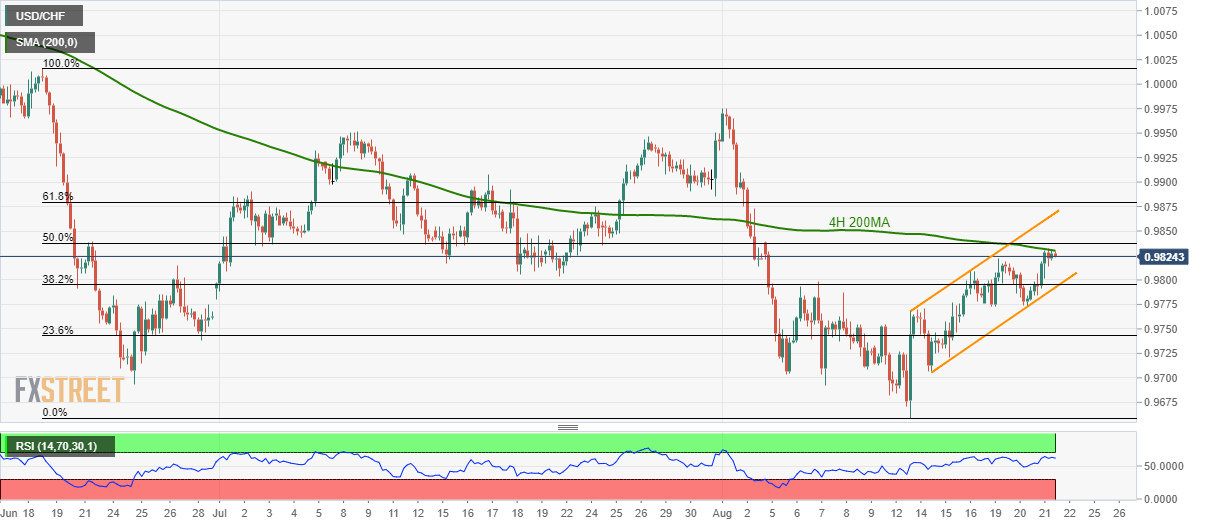
Despite trading near the early-month tops, USD/CHF still falls behind 200-bar moving average on the four-hour chart (4H 200MA) as it trades near 0.9825 while heading into Thursday’s Europe session opening.
Not only 4H 200MA level of 0.9830 but 50% Fibonacci retracement level of 0.9880 also challenges buyers observing a week-long rising trend-channel.
Should prices rally beyond 0.9880, channel’s resistance-line of 0.9870 and 61.8% Fibonacci retracement level of 0.9880 could lure the bulls.
If overbought conditions of 14-bar relative strength index (RSI) grab sellers’ attention, a pullback towards 0.9800-0.9790 area comprising 38.2% Fibonacci retracement and channel support can’t be denied.
In a case where bears dominate after 0.9790, 0.9760, 0.9700 and monthly low surrounding 0.9660 can be on the bears’ radar.
USD/CHF 4-hour chart
Trend: Pullback expected