Back
21 Aug 2019
USD/INR technical analysis: MACD portrays buyer exhaustion near short-term key supports
- USD/INR refrains from carrying the previous upside amid bearish MACD signal.
- 4H 50MA, eight-day long rising trend-line become important supports for now.
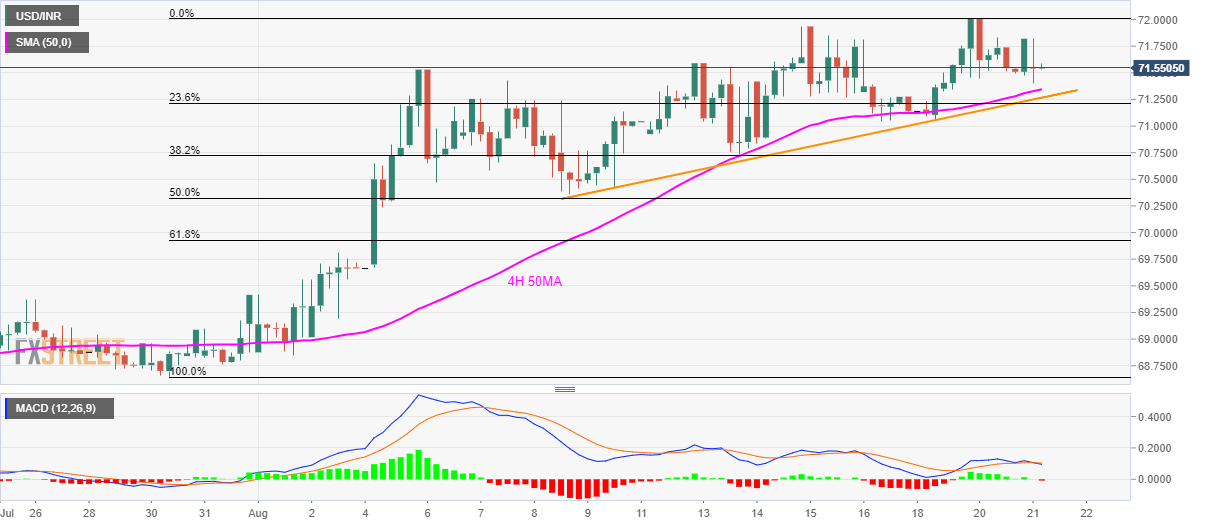
Not only failure to hold on to the strength after flashing the yearly high, bearish signal by MACD also favors the USD/INR pair’s pullback as it trades near 71.5750 ahead of Wednesday’s European session.
However, 50-bar moving average on the four-hour chart (4H 50MA) and an upward sloping trend-line since August 09, at 71.34 and 71.27 respectively, limit the pair’s immediate declines.
Should prices slip beneath 71.27, a fresh downward trajectory towards 50% Fibonacci retracement of July-end to Tuesday’s top, at 70.32 and then to 70.00 round-figure can well be anticipated.
Meanwhile, 71.85 and 72.00 can entertain buyers ahead of pushing them towards December 2018 high around 72.82.
USD/INR 4-hour chart
Trend: Pullback expected