Back
14 Aug 2019
US Dollar Index technical analysis: DXY clings to daily highs near the 98.00 handle
- DXY (US Dollar Index) is clinging to intraday gains near the 98.00 level.
- The next targets on the way can be located at 98.10 and the 98.38 levels.
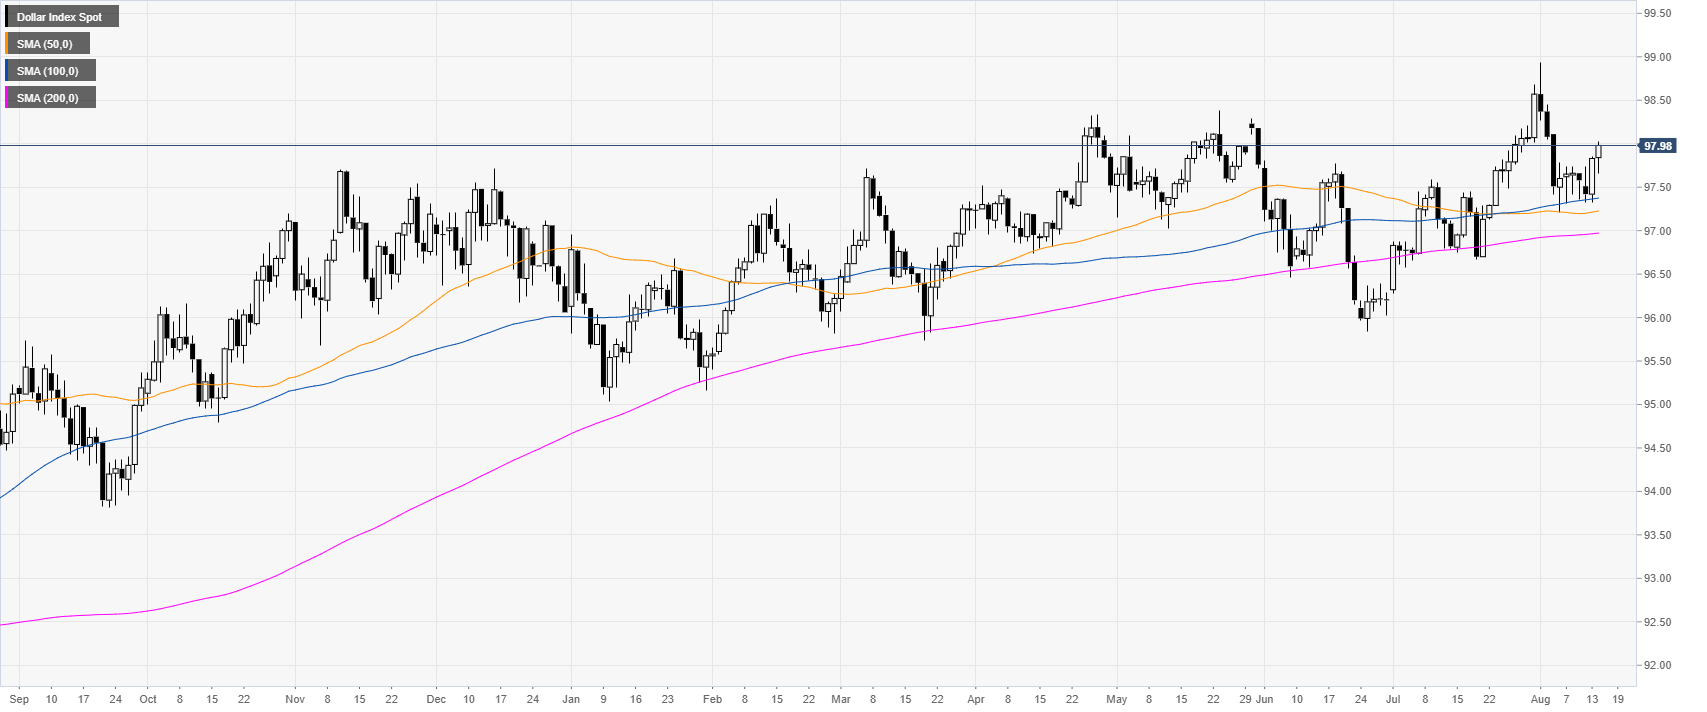
DXY daily chart
DXY (US Dollar Index) is trading in a bull trend above its main daily simple moving averages (DSMAs). Investors will be paying attention to the Retail Sales Control Group (July) coming up on Thursday.
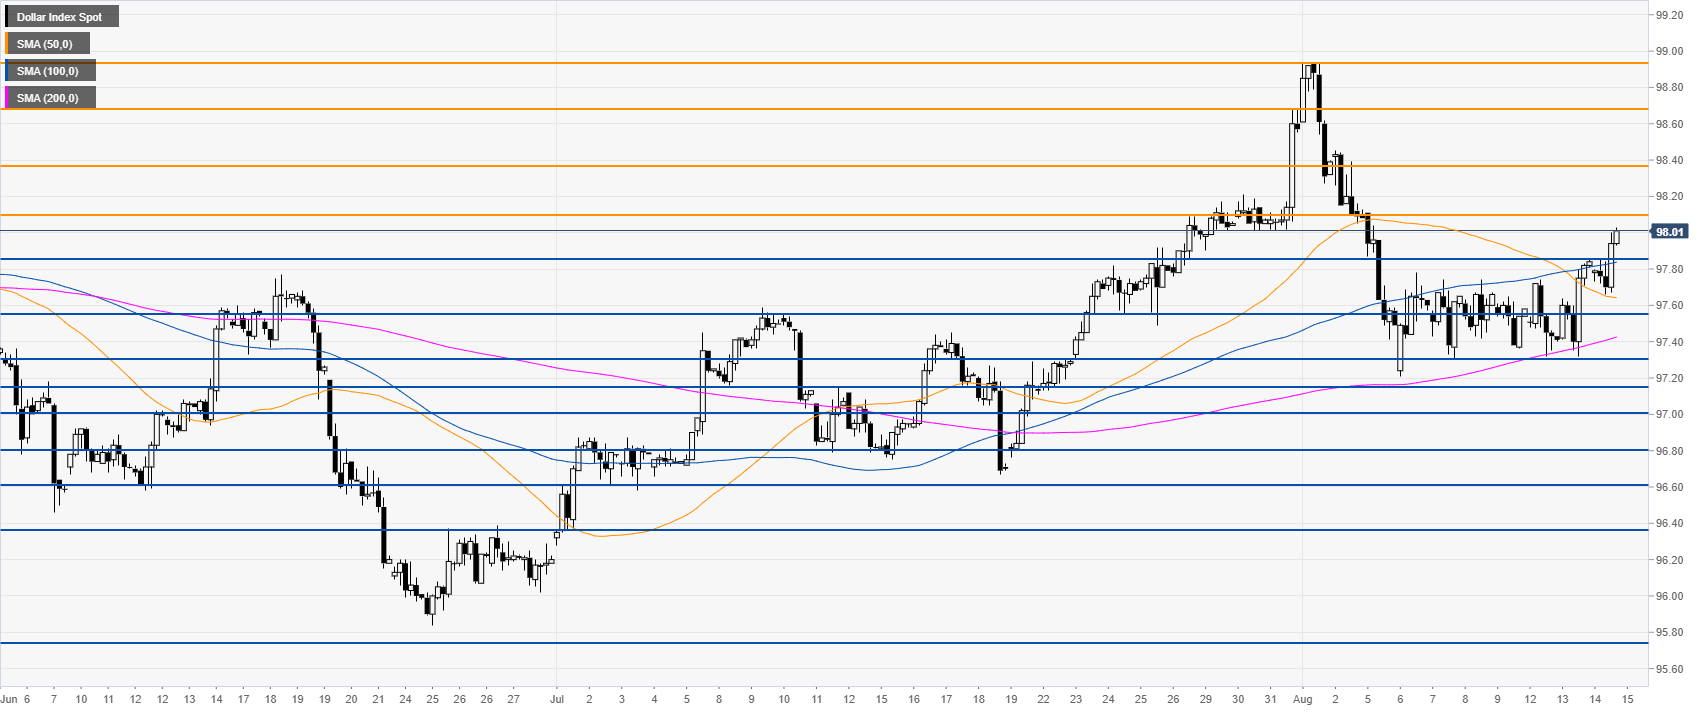
DXY 4-hour chart
The market is testing the 98.00 figure while trading above the main SMAs. DXY bulls could drive the market towards the 98.10 resistance. The next potential targets on the way up include 98.38, 98.68 and the 98.93 level.
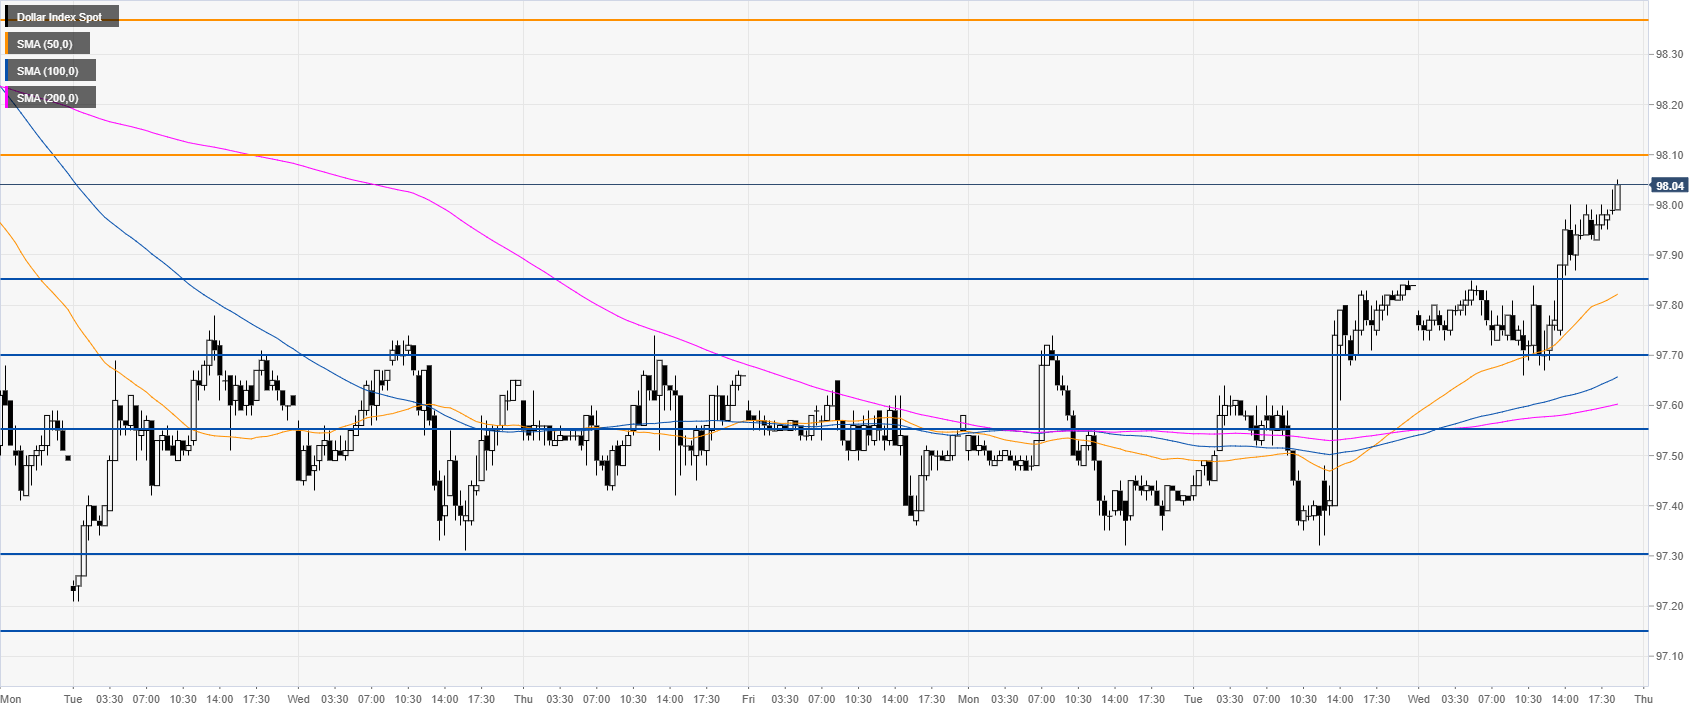
DXY 30-minute chart
The buying pressure keeps the Greenback to daily highs. Immediate support could be found near 97.85, 97.70 and 97.55.
Additional key levels