US Dollar Index Technical Analysis: DXY jumps above the 96.30 level
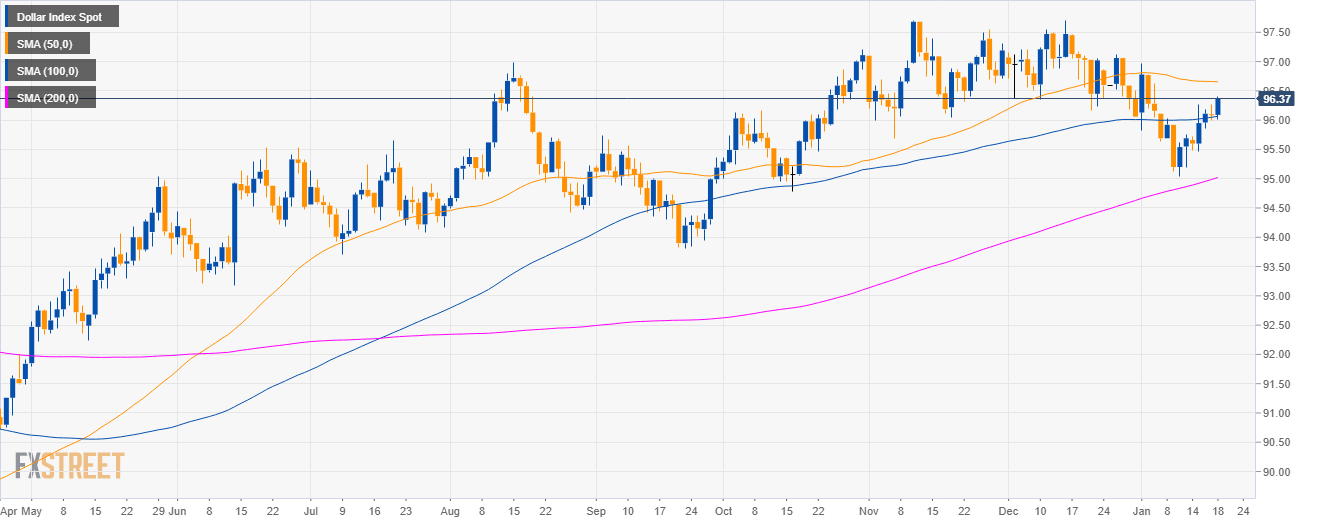
DXY daily chart
- The US Dollar Index (DXY) is trading in a bull trend above the 200-day simple moving average (SMA).
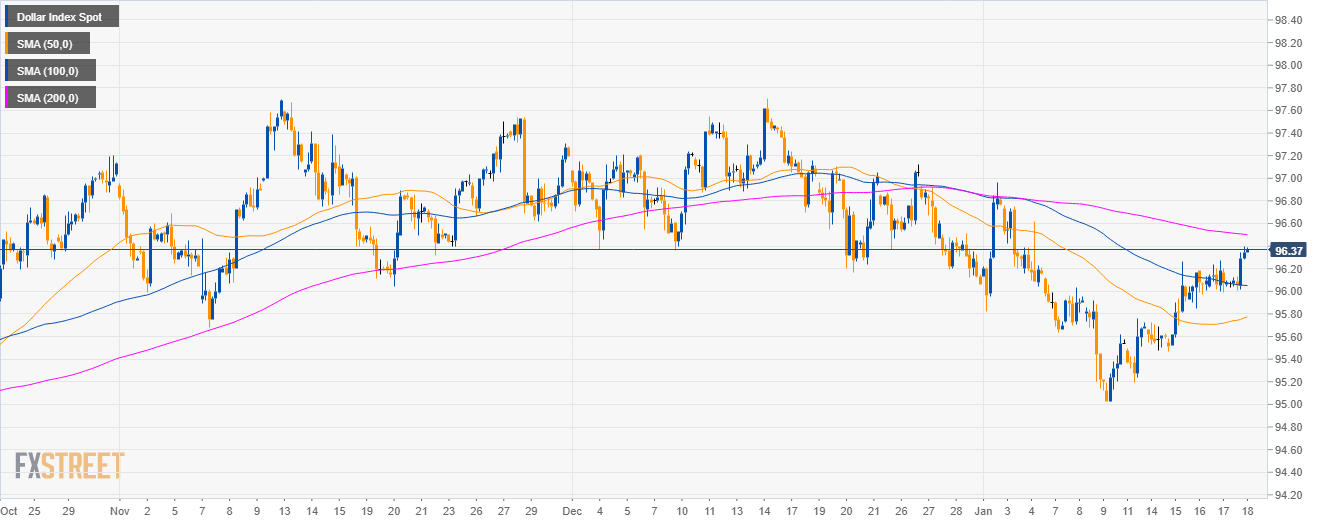
DXY 4-hour chart
- DXY jumped above the 96.30 resistance as the bulls reclaimes the 50 and 100 SMAs.
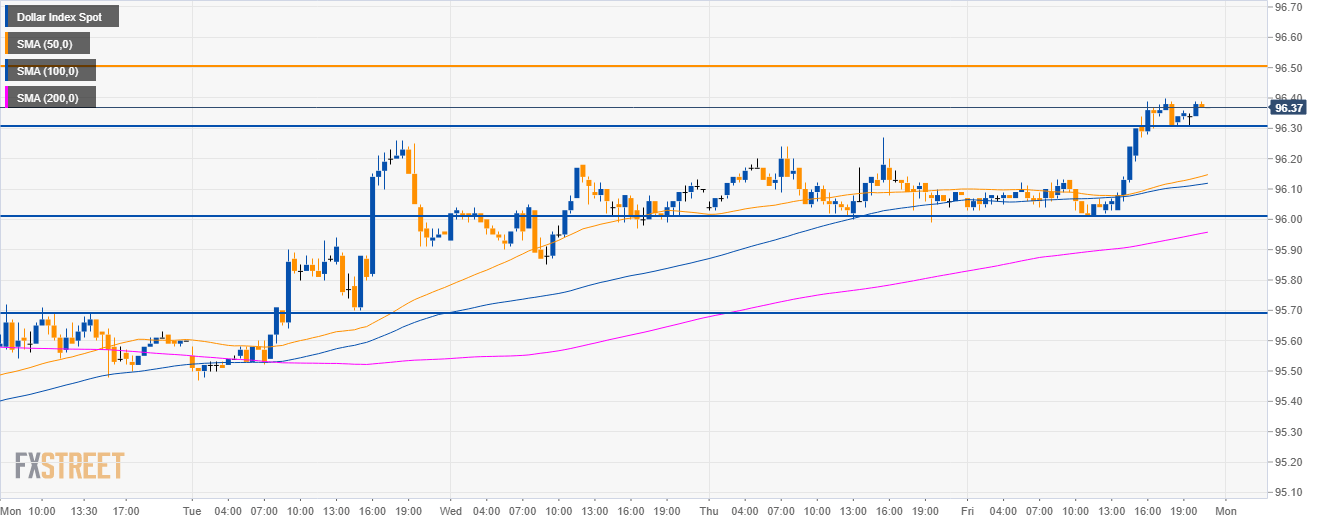
DXY 30-minute chart
- DXY is set to continue its upmove to 96.50 but it remains to be seen how far the bulls can keep the market going.
- To the downside, bears will be looking for 96.30 and 96.00 targets.
Additional key levels
Dollar Index Spot
Overview:
Today Last Price: 96.37
Today Daily change: 0.28 pips
Today Daily change %: 0.29%
Today Daily Open: 96.09
Trends:
Daily SMA20: 96.19
Daily SMA50: 96.66
Daily SMA100: 96.05
Daily SMA200: 94.99
Levels:
Previous Daily High: 96.27
Previous Daily Low: 95.99
Previous Weekly High: 96.12
Previous Weekly Low: 95.03
Previous Monthly High: 97.71
Previous Monthly Low: 96.06
Daily Fibonacci 38.2%: 96.1
Daily Fibonacci 61.8%: 96.16
Daily Pivot Point S1: 95.96
Daily Pivot Point S2: 95.84
Daily Pivot Point S3: 95.68
Daily Pivot Point R1: 96.24
Daily Pivot Point R2: 96.4
Daily Pivot Point R3: 96.52