EUR/USD Technical Analysis: Euro challenges the 1.1350 level to the downside
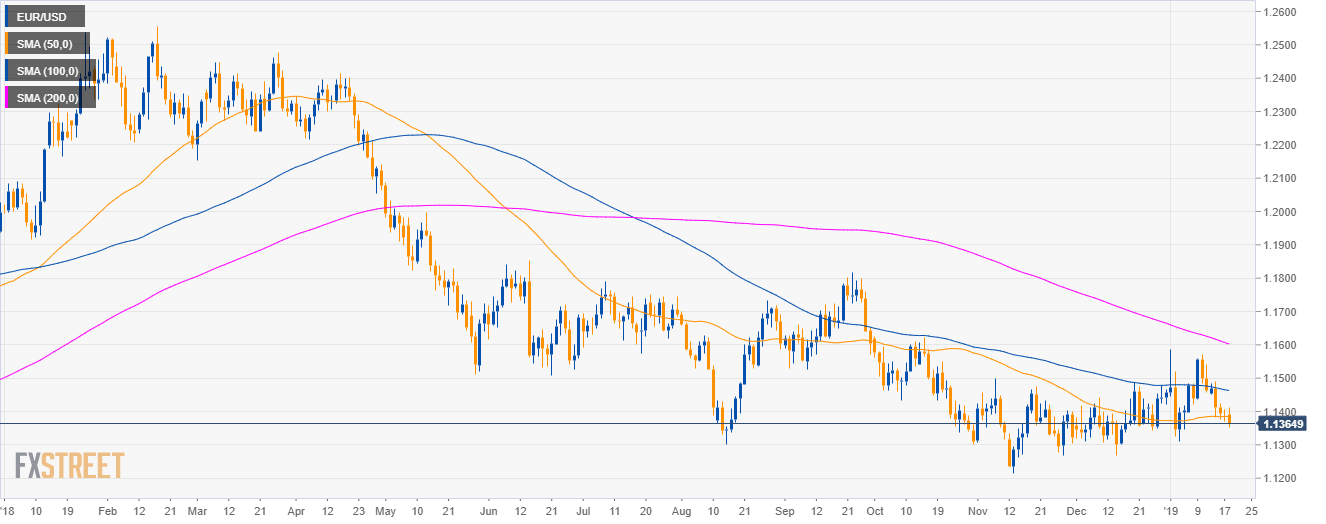
EUR/USD daily chart
- EUR/USD is trading in a bear trend below its 200-day simple moving averages (SMA).
- As discussed, the break of 1.1380 support lead the market to the 1.1350 level.
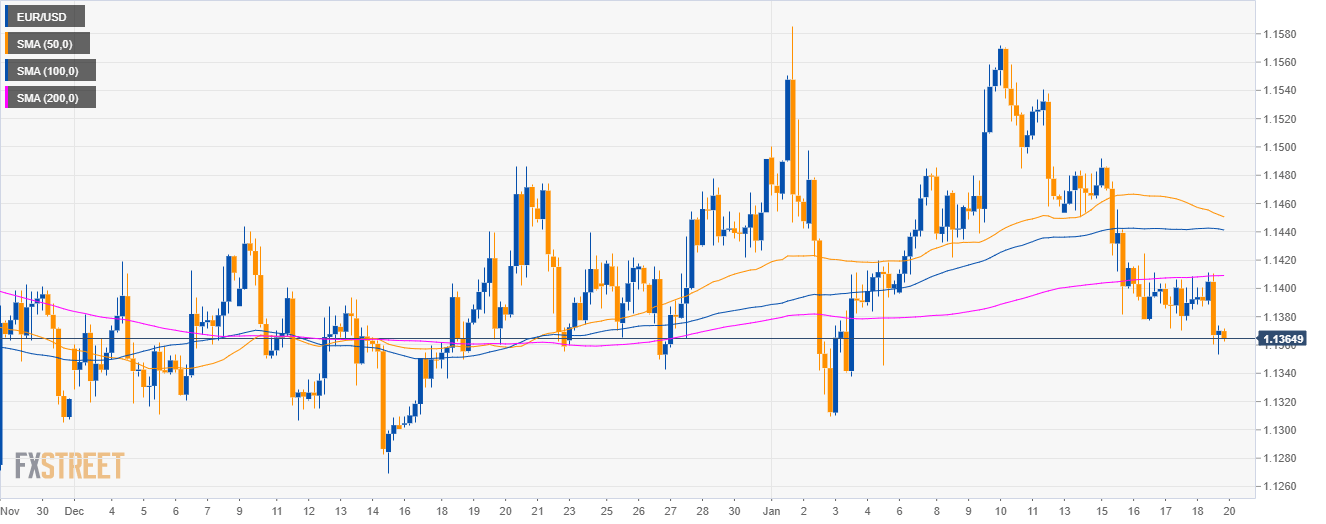
EUR/USD 4-hour chart
- EUR/USD is trading below its main SMAs as the market created a doji bar in the last hours of trading.
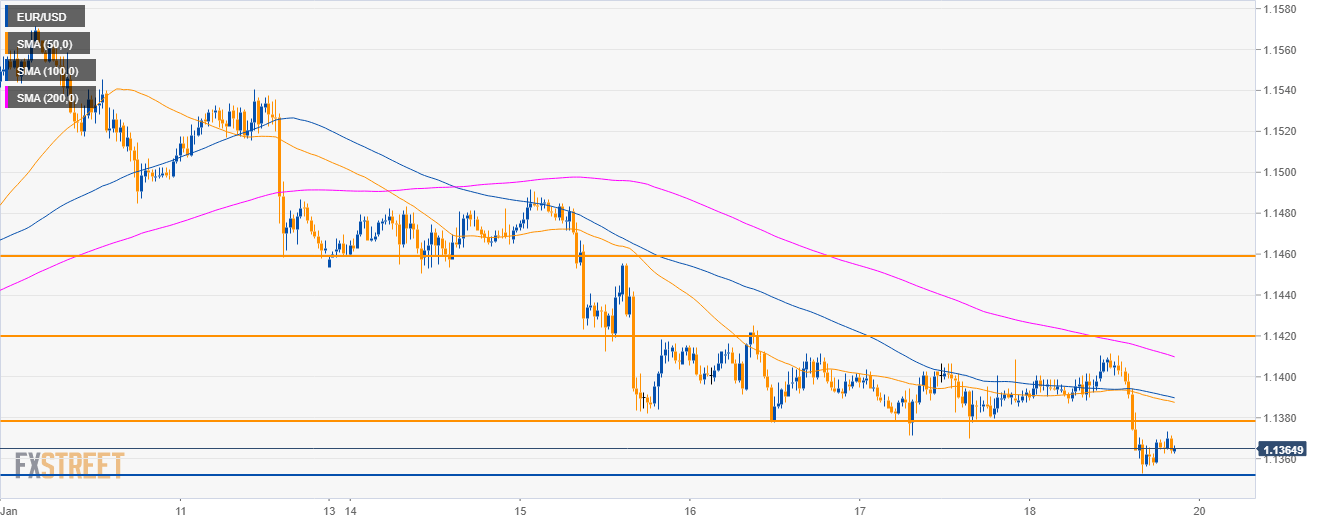
EUR/USD 30-minute chart
- Bears broke below the 1.1380 level to find support at 1.1350.
- Bulls are likely to recapture 1.1380, 1.1420 and 1.1460 to the upside.
Additional key levels
EUR/USD
Overview:
Today Last Price: 1.1365
Today Daily change: -0.0026 pips
Today Daily change %: -0.23%
Today Daily Open: 1.1391
Trends:
Daily SMA20: 1.1429
Daily SMA50: 1.1385
Daily SMA100: 1.1465
Daily SMA200: 1.1609
Levels:
Previous Daily High: 1.1406
Previous Daily Low: 1.137
Previous Weekly High: 1.1571
Previous Weekly Low: 1.1396
Previous Monthly High: 1.1486
Previous Monthly Low: 1.1269
Daily Fibonacci 38.2%: 1.1384
Daily Fibonacci 61.8%: 1.1393
Daily Pivot Point S1: 1.1372
Daily Pivot Point S2: 1.1353
Daily Pivot Point S3: 1.1336
Daily Pivot Point R1: 1.1409
Daily Pivot Point R2: 1.1426
Daily Pivot Point R3: 1.1445