Back
9 Oct 2018
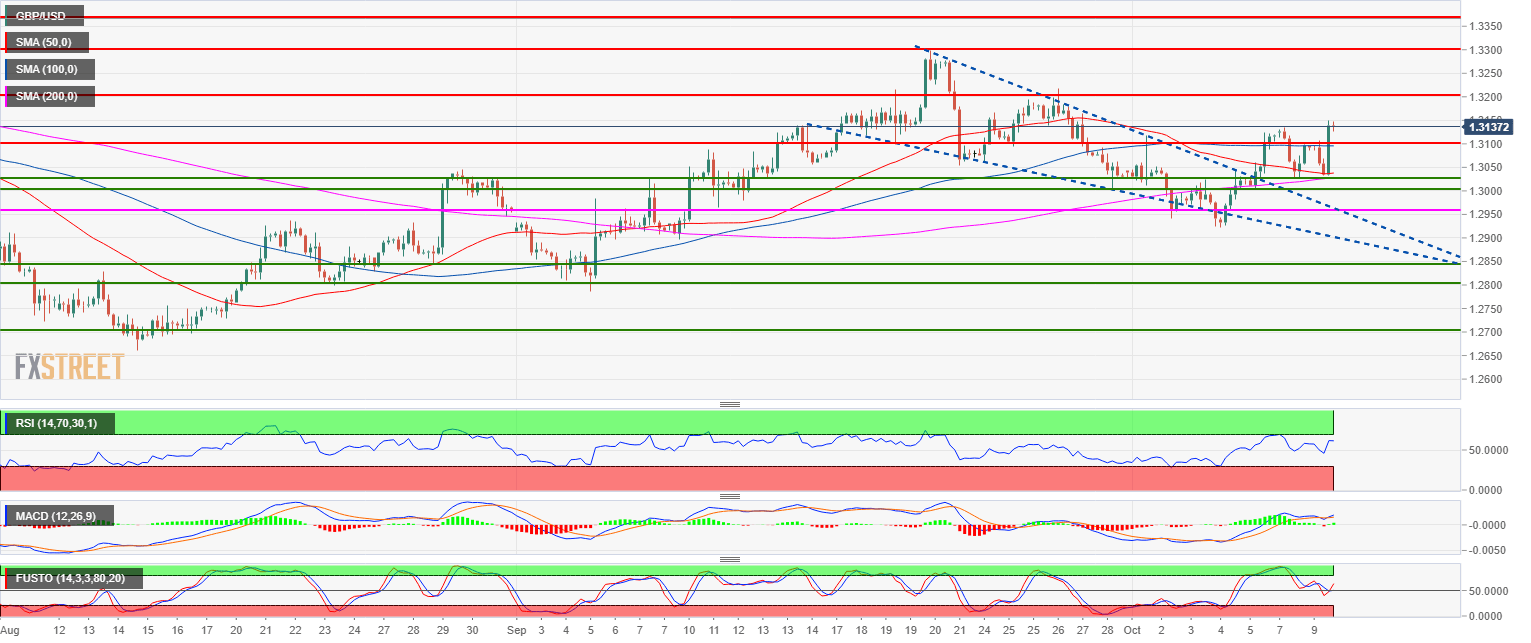
GBP/USD Technical Analysis: Cable shorts getting squeezed as bulls break above 1.3100 and now target 1.3200 figure
- GBP/USD is trading in a bull trend as it is evolving above its 50, 100 and 200-period.
- GBP/USD broke above a bull flag (blue lines) and now broke above the 1.3100 figure. The picture remains bullish on GBP/USD as long as the market trade above 1.2957-1.3000 figure.
- Bulls are now closer to the 1.3200 target as 1.3300 will become the next challenge for buyers.
GBP/USD 4-hour chart

Spot rate: 1.3138
Relative change: 0.38%
High: 1.3149
Low: 1.3033
Main trend: Bullish
Resistance 1: 1.3150 September 21 low
Resistance 2: 1.3200 figure
Resistance 3: 1.3300 figure
Support 1: 1.3100 figure
Support 2: 1.3050 August 30 swing high, key level
Support 3: 1.3028 October 8 low
Support 4: 1.3000 figure
Support 5: 1.2957 July 19 swing low
Support 6: 1.2900 figure
